Blackfeet vs Immigrants from Somalia Male Unemployment
COMPARE
Blackfeet
Immigrants from Somalia
Male Unemployment
Male Unemployment Comparison
Blackfeet
Immigrants from Somalia
6.0%
MALE UNEMPLOYMENT
0.0/ 100
METRIC RATING
271st/ 347
METRIC RANK
5.6%
MALE UNEMPLOYMENT
1.5/ 100
METRIC RATING
234th/ 347
METRIC RANK
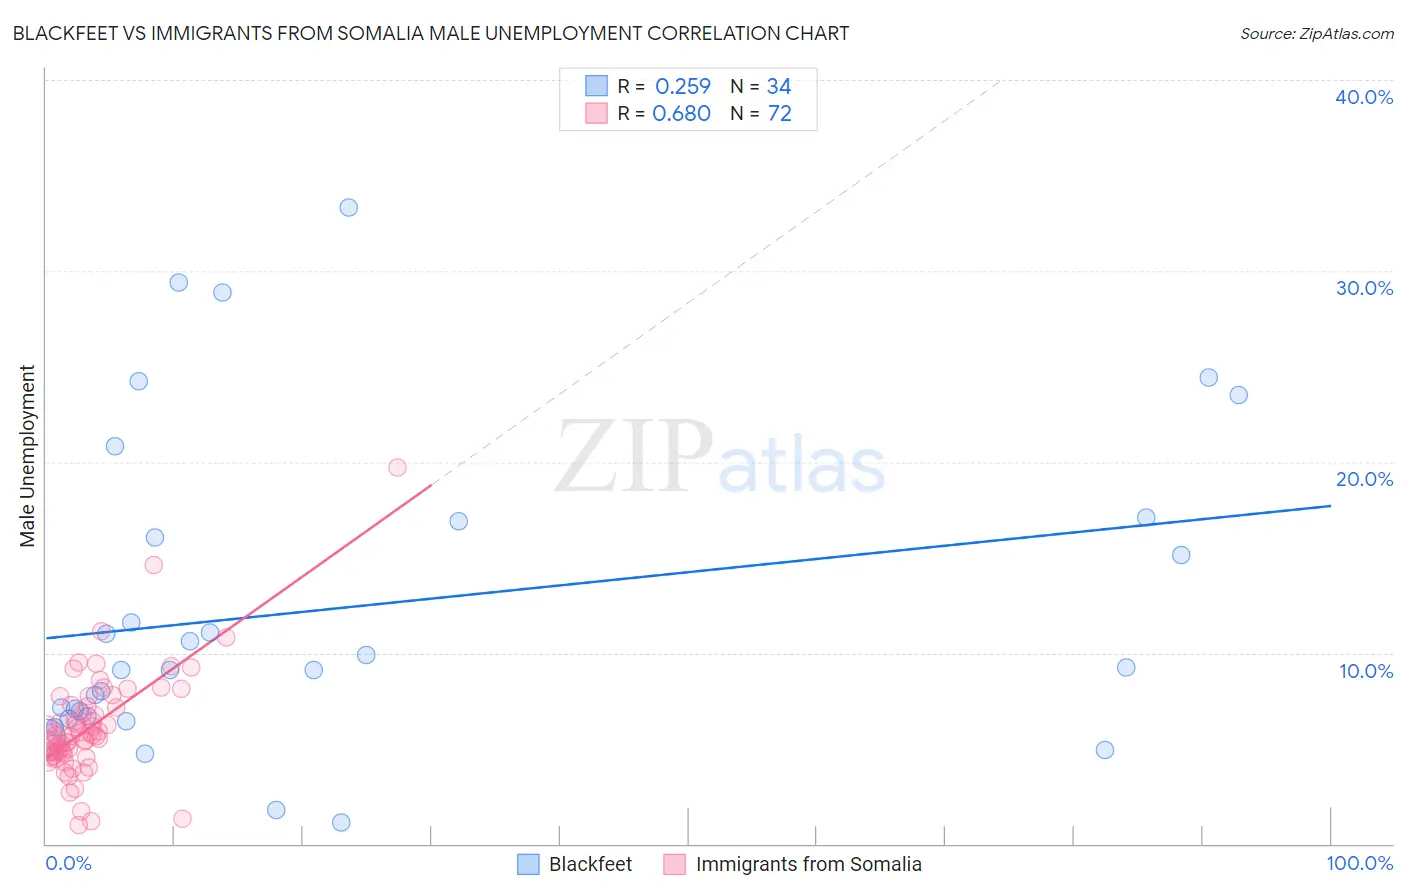
Blackfeet vs Immigrants from Somalia Male Unemployment Correlation Chart
The statistical analysis conducted on geographies consisting of 308,278,150 people shows a weak positive correlation between the proportion of Blackfeet and unemployment rate among males in the United States with a correlation coefficient (R) of 0.259 and weighted average of 6.0%. Similarly, the statistical analysis conducted on geographies consisting of 92,060,853 people shows a significant positive correlation between the proportion of Immigrants from Somalia and unemployment rate among males in the United States with a correlation coefficient (R) of 0.680 and weighted average of 5.6%, a difference of 6.7%.
Male Unemployment Correlation Summary
| Measurement | Blackfeet | Immigrants from Somalia |
| Minimum | 1.1% | 1.0% |
| Maximum | 33.3% | 19.7% |
| Range | 32.2% | 18.7% |
| Mean | 12.4% | 6.1% |
| Median | 9.2% | 5.6% |
| Interquartile 25% (IQ1) | 6.7% | 4.7% |
| Interquartile 75% (IQ3) | 16.9% | 7.2% |
| Interquartile Range (IQR) | 10.2% | 2.5% |
| Standard Deviation (Sample) | 8.3% | 2.8% |
| Standard Deviation (Population) | 8.2% | 2.8% |
Similar Demographics by Male Unemployment
Demographics Similar to Blackfeet by Male Unemployment
In terms of male unemployment, the demographic groups most similar to Blackfeet are Immigrants from Uzbekistan (6.0%, a difference of 0.23%), Armenian (6.0%, a difference of 0.24%), Immigrants from Sierra Leone (6.0%, a difference of 0.41%), Subsaharan African (6.0%, a difference of 0.50%), and Menominee (6.0%, a difference of 0.57%).
| Demographics | Rating | Rank | Male Unemployment |
| Immigrants | Mexico | 0.0 /100 | #264 | Tragic 5.9% |
| French American Indians | 0.0 /100 | #265 | Tragic 5.9% |
| Bahamians | 0.0 /100 | #266 | Tragic 5.9% |
| Nigerians | 0.0 /100 | #267 | Tragic 5.9% |
| Bermudans | 0.0 /100 | #268 | Tragic 5.9% |
| Immigrants | Nigeria | 0.0 /100 | #269 | Tragic 6.0% |
| Sub-Saharan Africans | 0.0 /100 | #270 | Tragic 6.0% |
| Blackfeet | 0.0 /100 | #271 | Tragic 6.0% |
| Immigrants | Uzbekistan | 0.0 /100 | #272 | Tragic 6.0% |
| Armenians | 0.0 /100 | #273 | Tragic 6.0% |
| Immigrants | Sierra Leone | 0.0 /100 | #274 | Tragic 6.0% |
| Menominee | 0.0 /100 | #275 | Tragic 6.0% |
| Tlingit-Haida | 0.0 /100 | #276 | Tragic 6.0% |
| Immigrants | Liberia | 0.0 /100 | #277 | Tragic 6.1% |
| Immigrants | Fiji | 0.0 /100 | #278 | Tragic 6.1% |
Demographics Similar to Immigrants from Somalia by Male Unemployment
In terms of male unemployment, the demographic groups most similar to Immigrants from Somalia are Somali (5.6%, a difference of 0.0%), Immigrants from Honduras (5.6%, a difference of 0.030%), Moroccan (5.6%, a difference of 0.080%), Choctaw (5.6%, a difference of 0.11%), and Immigrants from Africa (5.6%, a difference of 0.17%).
| Demographics | Rating | Rank | Male Unemployment |
| Immigrants | Panama | 1.8 /100 | #227 | Tragic 5.6% |
| Seminole | 1.8 /100 | #228 | Tragic 5.6% |
| Central Americans | 1.8 /100 | #229 | Tragic 5.6% |
| Immigrants | Africa | 1.7 /100 | #230 | Tragic 5.6% |
| Choctaw | 1.6 /100 | #231 | Tragic 5.6% |
| Moroccans | 1.6 /100 | #232 | Tragic 5.6% |
| Somalis | 1.5 /100 | #233 | Tragic 5.6% |
| Immigrants | Somalia | 1.5 /100 | #234 | Tragic 5.6% |
| Immigrants | Honduras | 1.5 /100 | #235 | Tragic 5.6% |
| Guatemalans | 1.2 /100 | #236 | Tragic 5.6% |
| Hondurans | 1.1 /100 | #237 | Tragic 5.6% |
| Native Hawaiians | 1.1 /100 | #238 | Tragic 5.6% |
| Immigrants | Guatemala | 1.1 /100 | #239 | Tragic 5.6% |
| Immigrants | Cameroon | 1.0 /100 | #240 | Tragic 5.6% |
| Salvadorans | 1.0 /100 | #241 | Tragic 5.7% |