Bhutanese vs Immigrants from Netherlands Vision Disability
COMPARE
Bhutanese
Immigrants from Netherlands
Vision Disability
Vision Disability Comparison
Bhutanese
Immigrants from Netherlands
2.0%
VISION DISABILITY
99.8/ 100
METRIC RATING
37th/ 347
METRIC RANK
2.1%
VISION DISABILITY
84.2/ 100
METRIC RATING
140th/ 347
METRIC RANK
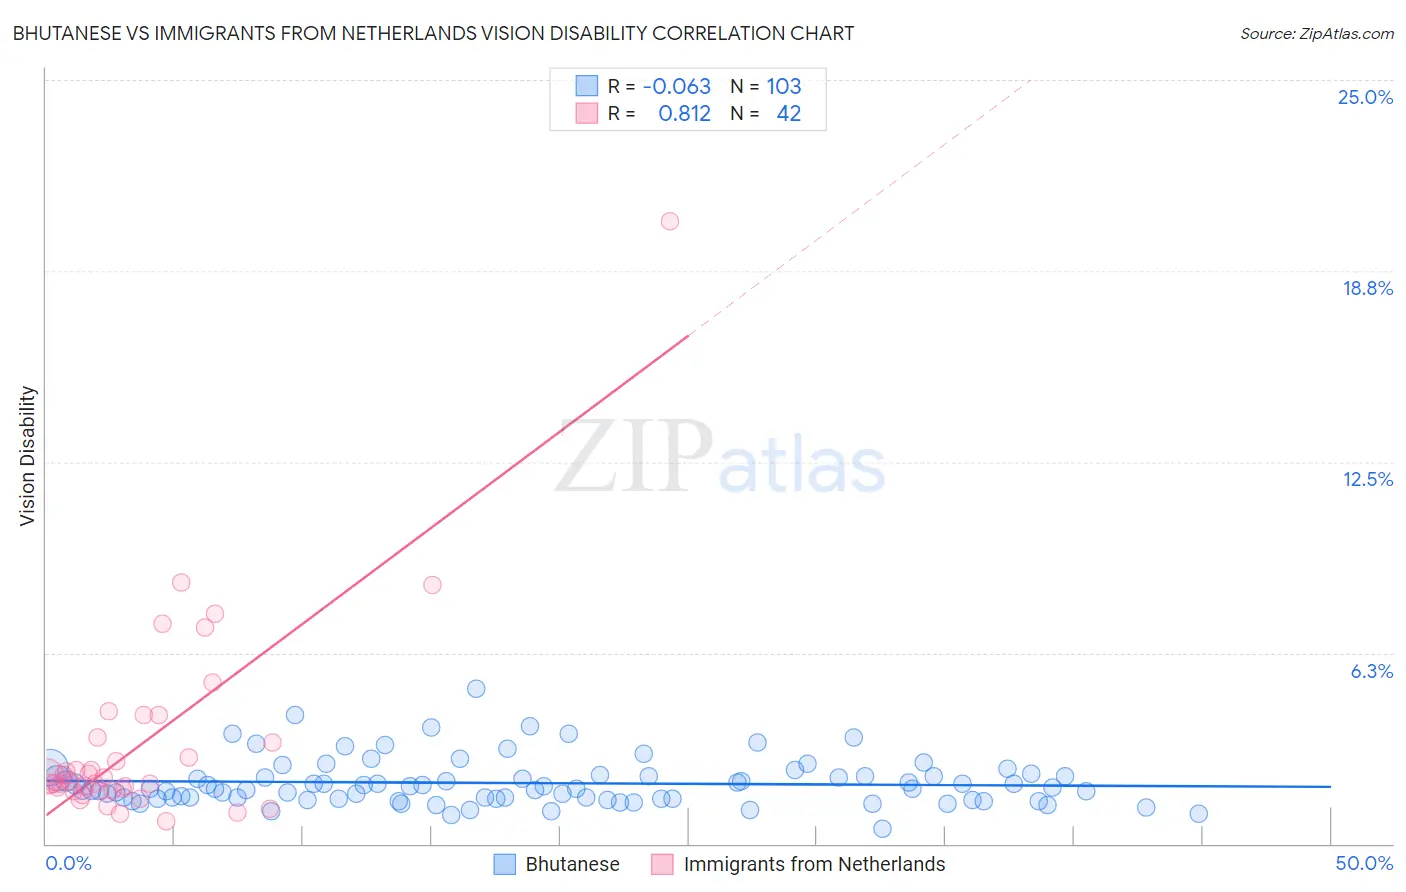
Bhutanese vs Immigrants from Netherlands Vision Disability Correlation Chart
The statistical analysis conducted on geographies consisting of 454,984,678 people shows a slight negative correlation between the proportion of Bhutanese and percentage of population with vision disability in the United States with a correlation coefficient (R) of -0.063 and weighted average of 2.0%. Similarly, the statistical analysis conducted on geographies consisting of 237,808,259 people shows a very strong positive correlation between the proportion of Immigrants from Netherlands and percentage of population with vision disability in the United States with a correlation coefficient (R) of 0.812 and weighted average of 2.1%, a difference of 7.6%.
Vision Disability Correlation Summary
| Measurement | Bhutanese | Immigrants from Netherlands |
| Minimum | 0.49% | 0.76% |
| Maximum | 5.1% | 20.4% |
| Range | 4.6% | 19.6% |
| Mean | 2.0% | 3.3% |
| Median | 1.8% | 2.1% |
| Interquartile 25% (IQ1) | 1.5% | 1.8% |
| Interquartile 75% (IQ3) | 2.2% | 3.5% |
| Interquartile Range (IQR) | 0.74% | 1.7% |
| Standard Deviation (Sample) | 0.77% | 3.4% |
| Standard Deviation (Population) | 0.76% | 3.3% |
Similar Demographics by Vision Disability
Demographics Similar to Bhutanese by Vision Disability
In terms of vision disability, the demographic groups most similar to Bhutanese are Immigrants from Kuwait (2.0%, a difference of 0.040%), Zimbabwean (2.0%, a difference of 0.090%), Cambodian (2.0%, a difference of 0.25%), Immigrants from Ireland (2.0%, a difference of 0.29%), and Cypriot (2.0%, a difference of 0.32%).
| Demographics | Rating | Rank | Vision Disability |
| Immigrants | Nepal | 99.9 /100 | #30 | Exceptional 1.9% |
| Mongolians | 99.9 /100 | #31 | Exceptional 1.9% |
| Luxembourgers | 99.9 /100 | #32 | Exceptional 1.9% |
| Immigrants | Egypt | 99.9 /100 | #33 | Exceptional 1.9% |
| Immigrants | Turkey | 99.8 /100 | #34 | Exceptional 1.9% |
| Immigrants | Australia | 99.8 /100 | #35 | Exceptional 1.9% |
| Cambodians | 99.8 /100 | #36 | Exceptional 2.0% |
| Bhutanese | 99.8 /100 | #37 | Exceptional 2.0% |
| Immigrants | Kuwait | 99.8 /100 | #38 | Exceptional 2.0% |
| Zimbabweans | 99.7 /100 | #39 | Exceptional 2.0% |
| Immigrants | Ireland | 99.7 /100 | #40 | Exceptional 2.0% |
| Cypriots | 99.7 /100 | #41 | Exceptional 2.0% |
| Immigrants | Ethiopia | 99.7 /100 | #42 | Exceptional 2.0% |
| Eastern Europeans | 99.7 /100 | #43 | Exceptional 2.0% |
| Immigrants | Indonesia | 99.7 /100 | #44 | Exceptional 2.0% |
Demographics Similar to Immigrants from Netherlands by Vision Disability
In terms of vision disability, the demographic groups most similar to Immigrants from Netherlands are Sierra Leonean (2.1%, a difference of 0.010%), Immigrants from Morocco (2.1%, a difference of 0.13%), South American (2.1%, a difference of 0.16%), Immigrants from Sierra Leone (2.1%, a difference of 0.16%), and Ukrainian (2.1%, a difference of 0.26%).
| Demographics | Rating | Rank | Vision Disability |
| Syrians | 87.5 /100 | #133 | Excellent 2.1% |
| Venezuelans | 87.2 /100 | #134 | Excellent 2.1% |
| Vietnamese | 86.7 /100 | #135 | Excellent 2.1% |
| Czechs | 86.3 /100 | #136 | Excellent 2.1% |
| Immigrants | South Eastern Asia | 86.3 /100 | #137 | Excellent 2.1% |
| Arabs | 86.3 /100 | #138 | Excellent 2.1% |
| Immigrants | Morocco | 85.2 /100 | #139 | Excellent 2.1% |
| Immigrants | Netherlands | 84.2 /100 | #140 | Excellent 2.1% |
| Sierra Leoneans | 84.1 /100 | #141 | Excellent 2.1% |
| South Americans | 82.8 /100 | #142 | Excellent 2.1% |
| Immigrants | Sierra Leone | 82.8 /100 | #143 | Excellent 2.1% |
| Ukrainians | 81.9 /100 | #144 | Excellent 2.1% |
| Immigrants | Bosnia and Herzegovina | 81.5 /100 | #145 | Excellent 2.1% |
| Italians | 79.7 /100 | #146 | Good 2.1% |
| Immigrants | Sudan | 78.4 /100 | #147 | Good 2.1% |