Bhutanese vs Immigrants from Portugal Vision Disability
COMPARE
Bhutanese
Immigrants from Portugal
Vision Disability
Vision Disability Comparison
Bhutanese
Immigrants from Portugal
2.0%
VISION DISABILITY
99.8/ 100
METRIC RATING
37th/ 347
METRIC RANK
2.3%
VISION DISABILITY
1.4/ 100
METRIC RATING
237th/ 347
METRIC RANK
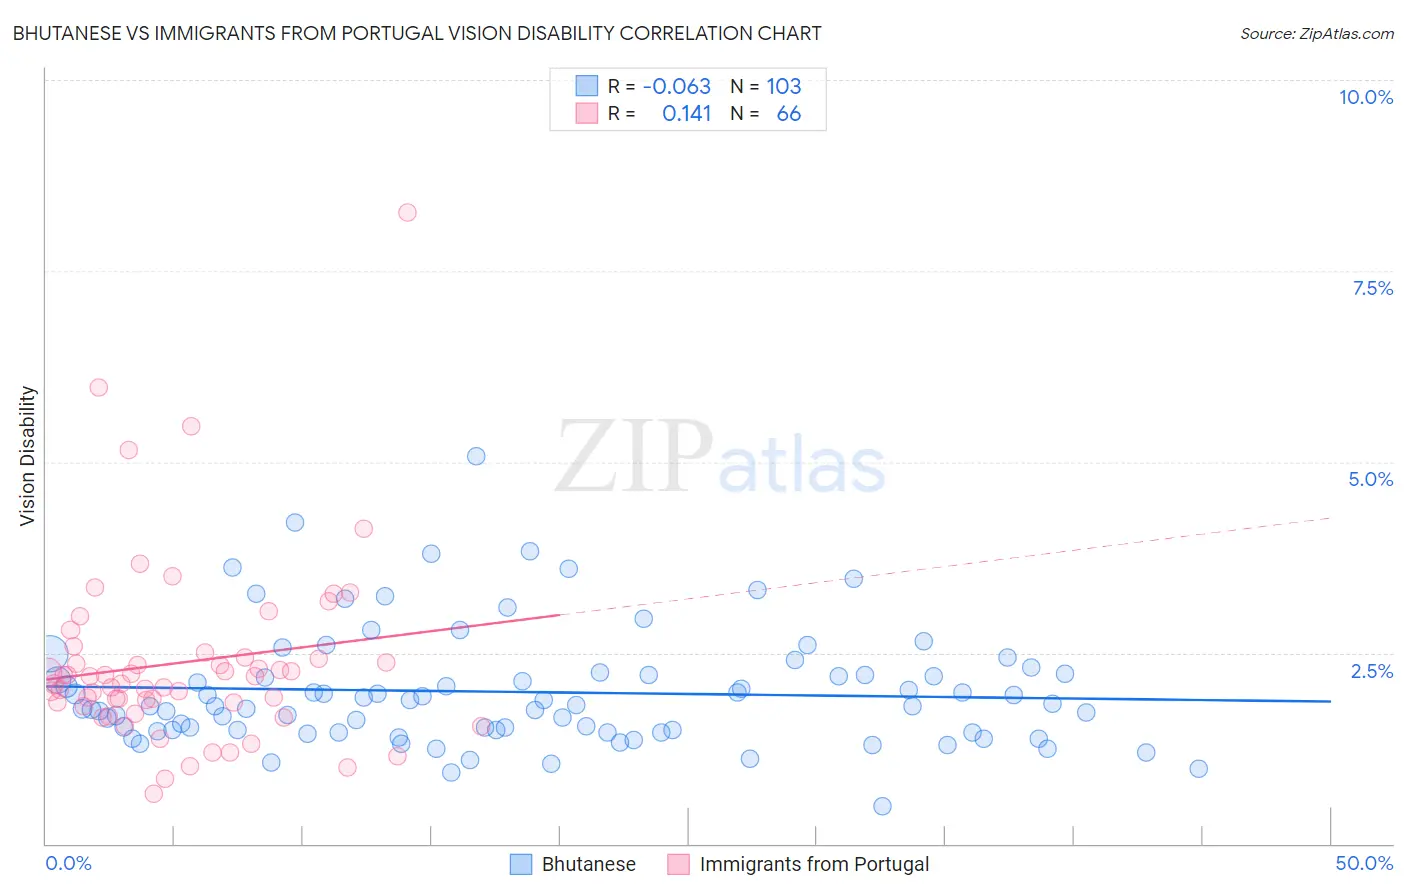
Bhutanese vs Immigrants from Portugal Vision Disability Correlation Chart
The statistical analysis conducted on geographies consisting of 454,984,678 people shows a slight negative correlation between the proportion of Bhutanese and percentage of population with vision disability in the United States with a correlation coefficient (R) of -0.063 and weighted average of 2.0%. Similarly, the statistical analysis conducted on geographies consisting of 174,661,842 people shows a poor positive correlation between the proportion of Immigrants from Portugal and percentage of population with vision disability in the United States with a correlation coefficient (R) of 0.141 and weighted average of 2.3%, a difference of 18.0%.
Vision Disability Correlation Summary
| Measurement | Bhutanese | Immigrants from Portugal |
| Minimum | 0.49% | 0.66% |
| Maximum | 5.1% | 8.3% |
| Range | 4.6% | 7.6% |
| Mean | 2.0% | 2.4% |
| Median | 1.8% | 2.1% |
| Interquartile 25% (IQ1) | 1.5% | 1.8% |
| Interquartile 75% (IQ3) | 2.2% | 2.4% |
| Interquartile Range (IQR) | 0.74% | 0.59% |
| Standard Deviation (Sample) | 0.77% | 1.2% |
| Standard Deviation (Population) | 0.76% | 1.2% |
Similar Demographics by Vision Disability
Demographics Similar to Bhutanese by Vision Disability
In terms of vision disability, the demographic groups most similar to Bhutanese are Immigrants from Kuwait (2.0%, a difference of 0.040%), Zimbabwean (2.0%, a difference of 0.090%), Cambodian (2.0%, a difference of 0.25%), Immigrants from Ireland (2.0%, a difference of 0.29%), and Cypriot (2.0%, a difference of 0.32%).
| Demographics | Rating | Rank | Vision Disability |
| Immigrants | Nepal | 99.9 /100 | #30 | Exceptional 1.9% |
| Mongolians | 99.9 /100 | #31 | Exceptional 1.9% |
| Luxembourgers | 99.9 /100 | #32 | Exceptional 1.9% |
| Immigrants | Egypt | 99.9 /100 | #33 | Exceptional 1.9% |
| Immigrants | Turkey | 99.8 /100 | #34 | Exceptional 1.9% |
| Immigrants | Australia | 99.8 /100 | #35 | Exceptional 1.9% |
| Cambodians | 99.8 /100 | #36 | Exceptional 2.0% |
| Bhutanese | 99.8 /100 | #37 | Exceptional 2.0% |
| Immigrants | Kuwait | 99.8 /100 | #38 | Exceptional 2.0% |
| Zimbabweans | 99.7 /100 | #39 | Exceptional 2.0% |
| Immigrants | Ireland | 99.7 /100 | #40 | Exceptional 2.0% |
| Cypriots | 99.7 /100 | #41 | Exceptional 2.0% |
| Immigrants | Ethiopia | 99.7 /100 | #42 | Exceptional 2.0% |
| Eastern Europeans | 99.7 /100 | #43 | Exceptional 2.0% |
| Immigrants | Indonesia | 99.7 /100 | #44 | Exceptional 2.0% |
Demographics Similar to Immigrants from Portugal by Vision Disability
In terms of vision disability, the demographic groups most similar to Immigrants from Portugal are Immigrants from Congo (2.3%, a difference of 0.050%), Marshallese (2.3%, a difference of 0.14%), Scottish (2.3%, a difference of 0.21%), Immigrants from Cambodia (2.3%, a difference of 0.27%), and English (2.3%, a difference of 0.29%).
| Demographics | Rating | Rank | Vision Disability |
| Nicaraguans | 2.2 /100 | #230 | Tragic 2.3% |
| Immigrants | Ecuador | 2.0 /100 | #231 | Tragic 2.3% |
| German Russians | 1.8 /100 | #232 | Tragic 2.3% |
| Central Americans | 1.8 /100 | #233 | Tragic 2.3% |
| Scottish | 1.6 /100 | #234 | Tragic 2.3% |
| Marshallese | 1.5 /100 | #235 | Tragic 2.3% |
| Immigrants | Congo | 1.4 /100 | #236 | Tragic 2.3% |
| Immigrants | Portugal | 1.4 /100 | #237 | Tragic 2.3% |
| Immigrants | Cambodia | 1.1 /100 | #238 | Tragic 2.3% |
| English | 1.1 /100 | #239 | Tragic 2.3% |
| Panamanians | 0.9 /100 | #240 | Tragic 2.3% |
| Malaysians | 0.9 /100 | #241 | Tragic 2.3% |
| Immigrants | Panama | 0.8 /100 | #242 | Tragic 2.3% |
| Immigrants | Nicaragua | 0.6 /100 | #243 | Tragic 2.3% |
| Immigrants | West Indies | 0.6 /100 | #244 | Tragic 2.3% |