Immigrants from Zimbabwe vs Immigrants from Netherlands Vision Disability
COMPARE
Immigrants from Zimbabwe
Immigrants from Netherlands
Vision Disability
Vision Disability Comparison
Immigrants from Zimbabwe
Immigrants from Netherlands
2.1%
VISION DISABILITY
91.0/ 100
METRIC RATING
120th/ 347
METRIC RANK
2.1%
VISION DISABILITY
84.2/ 100
METRIC RATING
140th/ 347
METRIC RANK
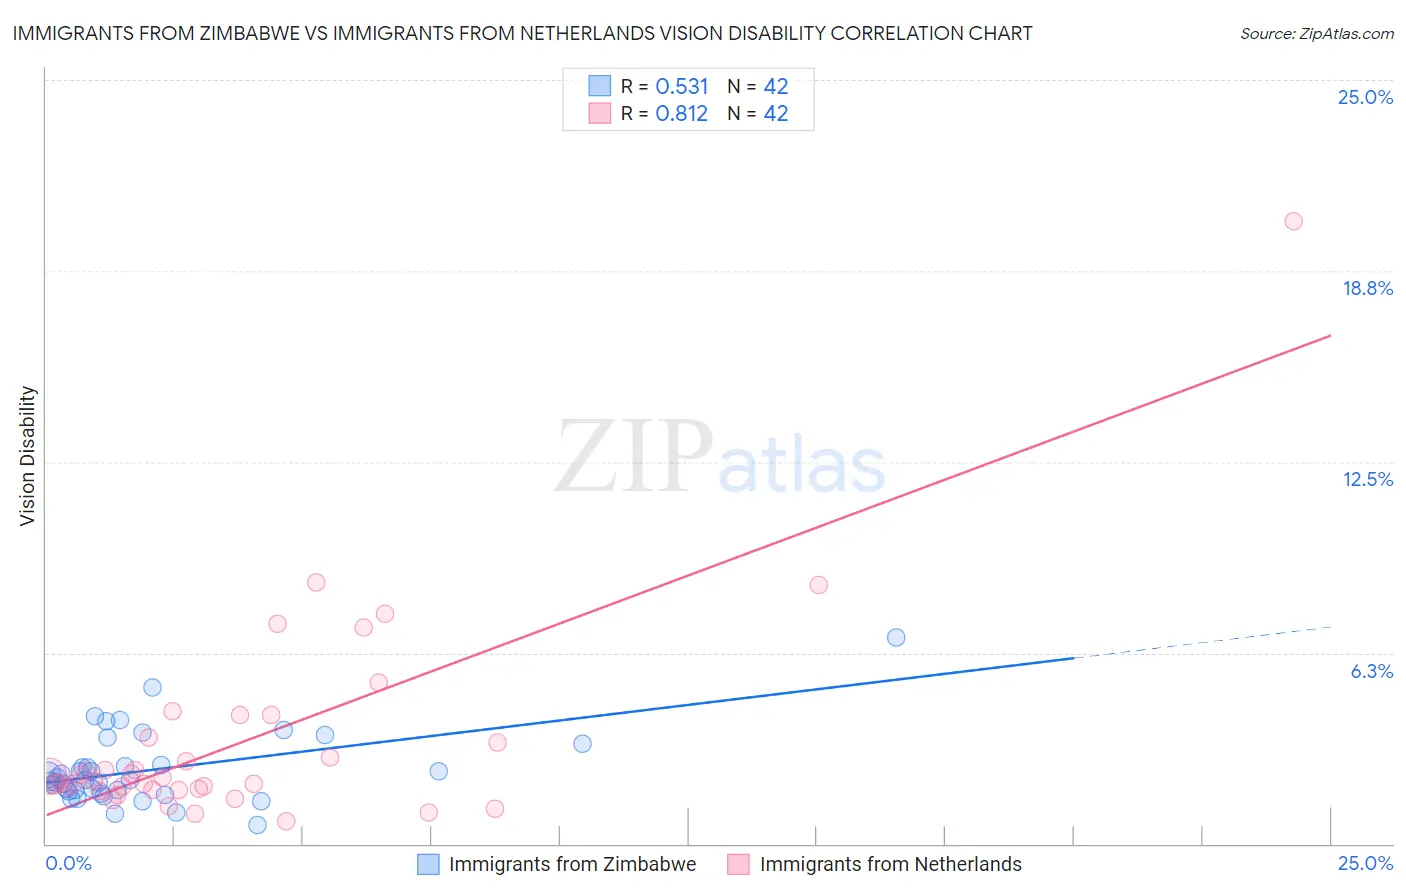
Immigrants from Zimbabwe vs Immigrants from Netherlands Vision Disability Correlation Chart
The statistical analysis conducted on geographies consisting of 117,800,208 people shows a substantial positive correlation between the proportion of Immigrants from Zimbabwe and percentage of population with vision disability in the United States with a correlation coefficient (R) of 0.531 and weighted average of 2.1%. Similarly, the statistical analysis conducted on geographies consisting of 237,808,259 people shows a very strong positive correlation between the proportion of Immigrants from Netherlands and percentage of population with vision disability in the United States with a correlation coefficient (R) of 0.812 and weighted average of 2.1%, a difference of 1.1%.
Vision Disability Correlation Summary
| Measurement | Immigrants from Zimbabwe | Immigrants from Netherlands |
| Minimum | 0.59% | 0.76% |
| Maximum | 6.8% | 20.4% |
| Range | 6.2% | 19.6% |
| Mean | 2.4% | 3.3% |
| Median | 2.1% | 2.1% |
| Interquartile 25% (IQ1) | 1.7% | 1.8% |
| Interquartile 75% (IQ3) | 2.6% | 3.5% |
| Interquartile Range (IQR) | 0.89% | 1.7% |
| Standard Deviation (Sample) | 1.2% | 3.4% |
| Standard Deviation (Population) | 1.2% | 3.3% |
Demographics Similar to Immigrants from Zimbabwe and Immigrants from Netherlands by Vision Disability
In terms of vision disability, the demographic groups most similar to Immigrants from Zimbabwe are Immigrants from Scotland (2.1%, a difference of 0.12%), Immigrants from Ukraine (2.1%, a difference of 0.13%), Immigrants from Albania (2.1%, a difference of 0.13%), Immigrants from Spain (2.1%, a difference of 0.24%), and Immigrants from Venezuela (2.1%, a difference of 0.24%). Similarly, the demographic groups most similar to Immigrants from Netherlands are Immigrants from Morocco (2.1%, a difference of 0.13%), Arab (2.1%, a difference of 0.27%), Czech (2.1%, a difference of 0.28%), Immigrants from South Eastern Asia (2.1%, a difference of 0.28%), and Vietnamese (2.1%, a difference of 0.33%).
| Demographics | Rating | Rank | Vision Disability |
| Immigrants | Zimbabwe | 91.0 /100 | #120 | Exceptional 2.1% |
| Immigrants | Scotland | 90.4 /100 | #121 | Exceptional 2.1% |
| Immigrants | Ukraine | 90.4 /100 | #122 | Exceptional 2.1% |
| Immigrants | Albania | 90.4 /100 | #123 | Exceptional 2.1% |
| Immigrants | Spain | 89.8 /100 | #124 | Excellent 2.1% |
| Immigrants | Venezuela | 89.8 /100 | #125 | Excellent 2.1% |
| Immigrants | Peru | 89.5 /100 | #126 | Excellent 2.1% |
| Sudanese | 89.2 /100 | #127 | Excellent 2.1% |
| Immigrants | Chile | 89.0 /100 | #128 | Excellent 2.1% |
| Immigrants | Cameroon | 88.8 /100 | #129 | Excellent 2.1% |
| Immigrants | Kenya | 88.7 /100 | #130 | Excellent 2.1% |
| Immigrants | Hungary | 88.7 /100 | #131 | Excellent 2.1% |
| New Zealanders | 88.2 /100 | #132 | Excellent 2.1% |
| Syrians | 87.5 /100 | #133 | Excellent 2.1% |
| Venezuelans | 87.2 /100 | #134 | Excellent 2.1% |
| Vietnamese | 86.7 /100 | #135 | Excellent 2.1% |
| Czechs | 86.3 /100 | #136 | Excellent 2.1% |
| Immigrants | South Eastern Asia | 86.3 /100 | #137 | Excellent 2.1% |
| Arabs | 86.3 /100 | #138 | Excellent 2.1% |
| Immigrants | Morocco | 85.2 /100 | #139 | Excellent 2.1% |
| Immigrants | Netherlands | 84.2 /100 | #140 | Excellent 2.1% |