Kenyan vs Immigrants from Netherlands Vision Disability
COMPARE
Kenyan
Immigrants from Netherlands
Vision Disability
Vision Disability Comparison
Kenyans
Immigrants from Netherlands
2.1%
VISION DISABILITY
92.5/ 100
METRIC RATING
113th/ 347
METRIC RANK
2.1%
VISION DISABILITY
84.2/ 100
METRIC RATING
140th/ 347
METRIC RANK
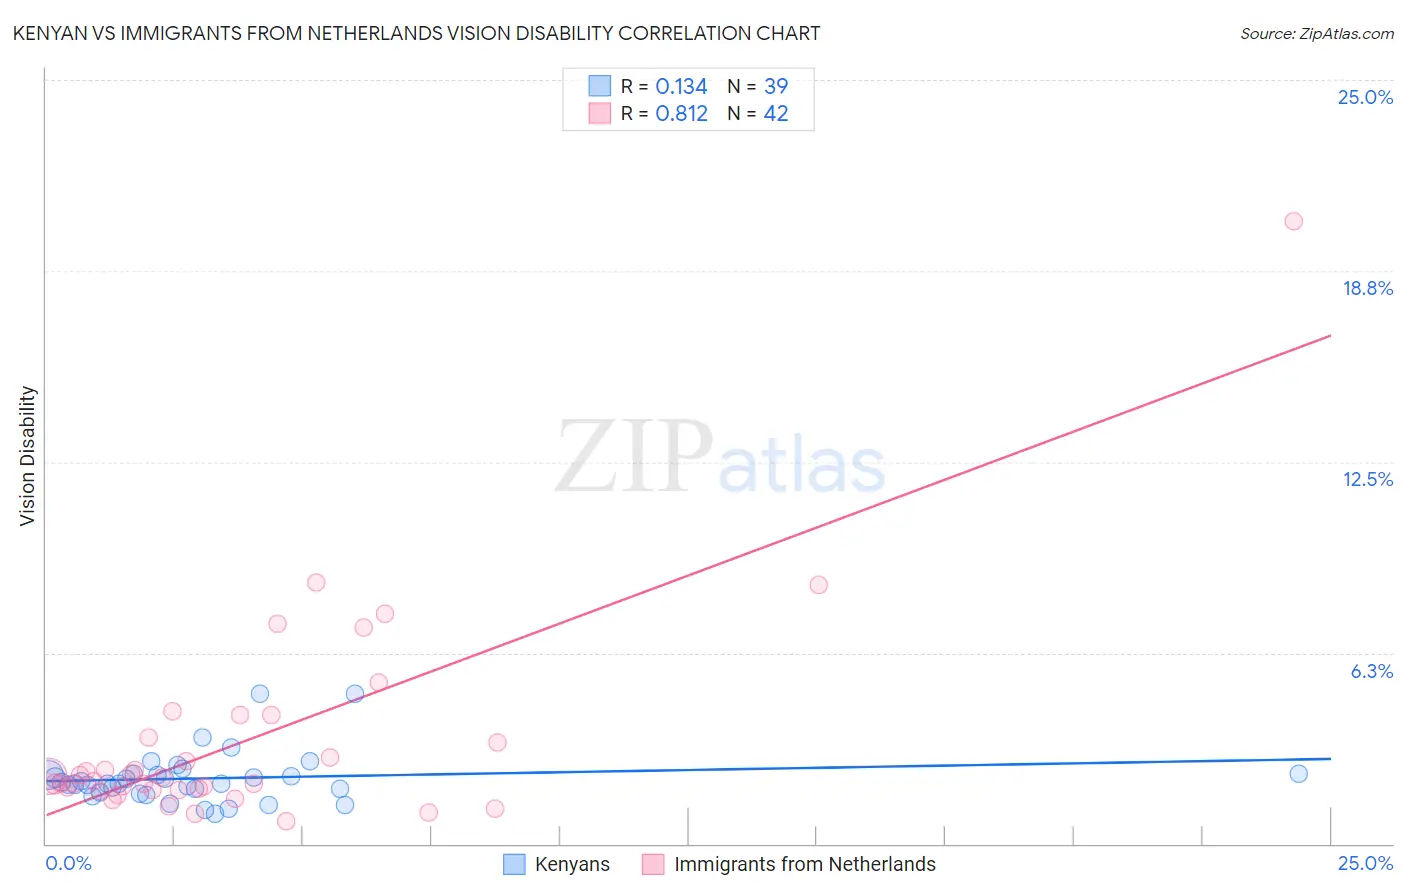
Kenyan vs Immigrants from Netherlands Vision Disability Correlation Chart
The statistical analysis conducted on geographies consisting of 168,152,432 people shows a poor positive correlation between the proportion of Kenyans and percentage of population with vision disability in the United States with a correlation coefficient (R) of 0.134 and weighted average of 2.1%. Similarly, the statistical analysis conducted on geographies consisting of 237,808,259 people shows a very strong positive correlation between the proportion of Immigrants from Netherlands and percentage of population with vision disability in the United States with a correlation coefficient (R) of 0.812 and weighted average of 2.1%, a difference of 1.4%.
Vision Disability Correlation Summary
| Measurement | Kenyan | Immigrants from Netherlands |
| Minimum | 0.99% | 0.76% |
| Maximum | 4.9% | 20.4% |
| Range | 3.9% | 19.6% |
| Mean | 2.1% | 3.3% |
| Median | 2.0% | 2.1% |
| Interquartile 25% (IQ1) | 1.7% | 1.8% |
| Interquartile 75% (IQ3) | 2.3% | 3.5% |
| Interquartile Range (IQR) | 0.58% | 1.7% |
| Standard Deviation (Sample) | 0.84% | 3.4% |
| Standard Deviation (Population) | 0.83% | 3.3% |
Similar Demographics by Vision Disability
Demographics Similar to Kenyans by Vision Disability
In terms of vision disability, the demographic groups most similar to Kenyans are Croatian (2.1%, a difference of 0.030%), Immigrants from Vietnam (2.1%, a difference of 0.060%), Ugandan (2.1%, a difference of 0.060%), Polish (2.1%, a difference of 0.11%), and Immigrants from Denmark (2.1%, a difference of 0.12%).
| Demographics | Rating | Rank | Vision Disability |
| Swedes | 94.2 /100 | #106 | Exceptional 2.1% |
| Danes | 94.2 /100 | #107 | Exceptional 2.1% |
| Koreans | 94.1 /100 | #108 | Exceptional 2.1% |
| Chileans | 94.0 /100 | #109 | Exceptional 2.1% |
| Immigrants | Armenia | 93.8 /100 | #110 | Exceptional 2.1% |
| Peruvians | 93.5 /100 | #111 | Exceptional 2.1% |
| Immigrants | Denmark | 92.9 /100 | #112 | Exceptional 2.1% |
| Kenyans | 92.5 /100 | #113 | Exceptional 2.1% |
| Croatians | 92.3 /100 | #114 | Exceptional 2.1% |
| Immigrants | Vietnam | 92.2 /100 | #115 | Exceptional 2.1% |
| Ugandans | 92.2 /100 | #116 | Exceptional 2.1% |
| Poles | 92.0 /100 | #117 | Exceptional 2.1% |
| Immigrants | Philippines | 91.4 /100 | #118 | Exceptional 2.1% |
| Immigrants | Uganda | 91.4 /100 | #119 | Exceptional 2.1% |
| Immigrants | Zimbabwe | 91.0 /100 | #120 | Exceptional 2.1% |
Demographics Similar to Immigrants from Netherlands by Vision Disability
In terms of vision disability, the demographic groups most similar to Immigrants from Netherlands are Sierra Leonean (2.1%, a difference of 0.010%), Immigrants from Morocco (2.1%, a difference of 0.13%), South American (2.1%, a difference of 0.16%), Immigrants from Sierra Leone (2.1%, a difference of 0.16%), and Ukrainian (2.1%, a difference of 0.26%).
| Demographics | Rating | Rank | Vision Disability |
| Syrians | 87.5 /100 | #133 | Excellent 2.1% |
| Venezuelans | 87.2 /100 | #134 | Excellent 2.1% |
| Vietnamese | 86.7 /100 | #135 | Excellent 2.1% |
| Czechs | 86.3 /100 | #136 | Excellent 2.1% |
| Immigrants | South Eastern Asia | 86.3 /100 | #137 | Excellent 2.1% |
| Arabs | 86.3 /100 | #138 | Excellent 2.1% |
| Immigrants | Morocco | 85.2 /100 | #139 | Excellent 2.1% |
| Immigrants | Netherlands | 84.2 /100 | #140 | Excellent 2.1% |
| Sierra Leoneans | 84.1 /100 | #141 | Excellent 2.1% |
| South Americans | 82.8 /100 | #142 | Excellent 2.1% |
| Immigrants | Sierra Leone | 82.8 /100 | #143 | Excellent 2.1% |
| Ukrainians | 81.9 /100 | #144 | Excellent 2.1% |
| Immigrants | Bosnia and Herzegovina | 81.5 /100 | #145 | Excellent 2.1% |
| Italians | 79.7 /100 | #146 | Good 2.1% |
| Immigrants | Sudan | 78.4 /100 | #147 | Good 2.1% |