Senegalese vs Immigrants from Netherlands Vision Disability
COMPARE
Senegalese
Immigrants from Netherlands
Vision Disability
Vision Disability Comparison
Senegalese
Immigrants from Netherlands
2.4%
VISION DISABILITY
0.1/ 100
METRIC RATING
268th/ 347
METRIC RANK
2.1%
VISION DISABILITY
84.2/ 100
METRIC RATING
140th/ 347
METRIC RANK
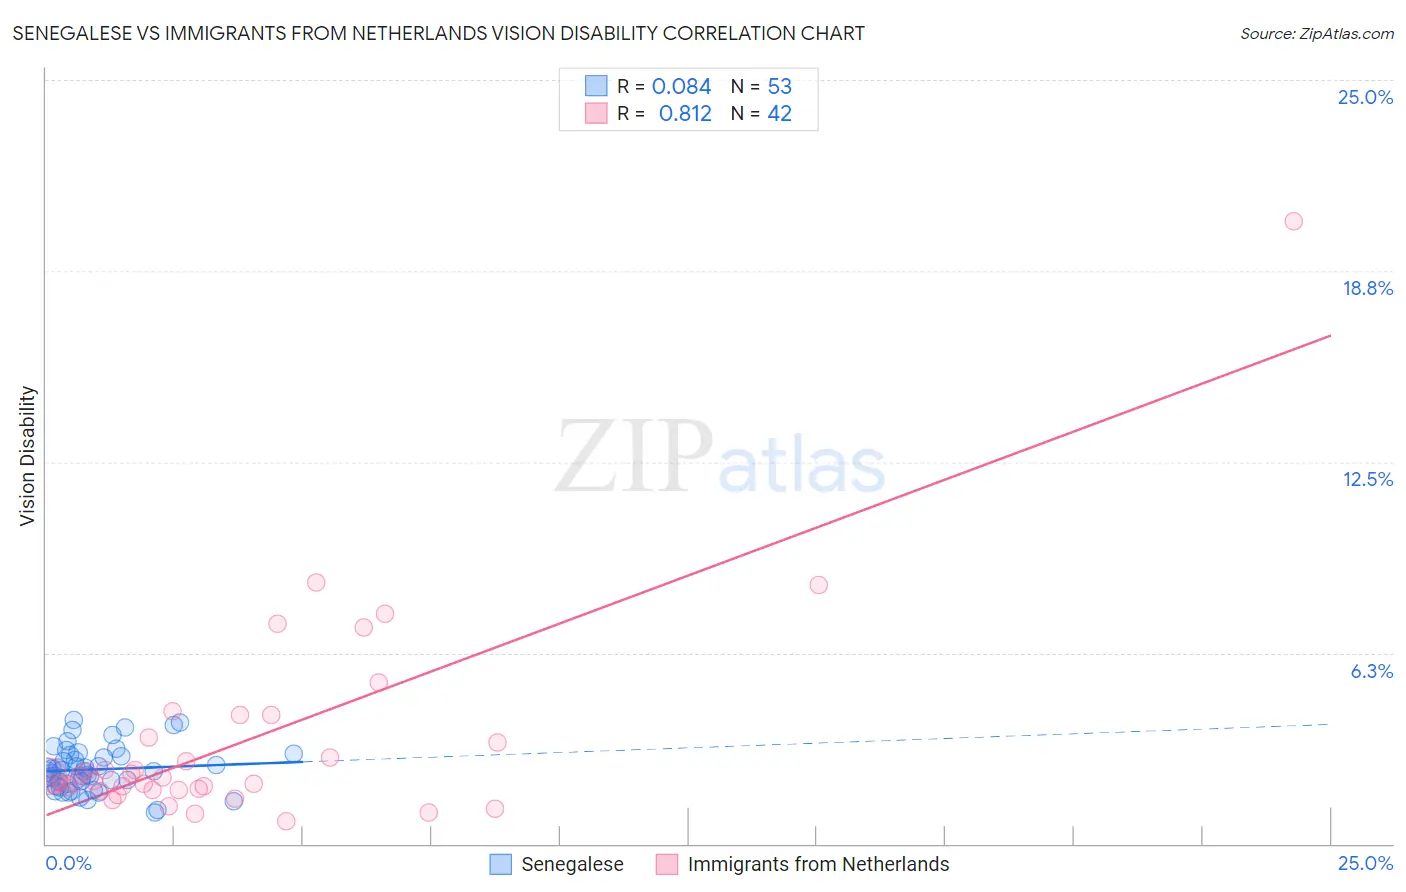
Senegalese vs Immigrants from Netherlands Vision Disability Correlation Chart
The statistical analysis conducted on geographies consisting of 78,129,878 people shows a slight positive correlation between the proportion of Senegalese and percentage of population with vision disability in the United States with a correlation coefficient (R) of 0.084 and weighted average of 2.4%. Similarly, the statistical analysis conducted on geographies consisting of 237,808,259 people shows a very strong positive correlation between the proportion of Immigrants from Netherlands and percentage of population with vision disability in the United States with a correlation coefficient (R) of 0.812 and weighted average of 2.1%, a difference of 13.9%.
Vision Disability Correlation Summary
| Measurement | Senegalese | Immigrants from Netherlands |
| Minimum | 1.0% | 0.76% |
| Maximum | 4.0% | 20.4% |
| Range | 3.0% | 19.6% |
| Mean | 2.4% | 3.3% |
| Median | 2.4% | 2.1% |
| Interquartile 25% (IQ1) | 1.9% | 1.8% |
| Interquartile 75% (IQ3) | 2.9% | 3.5% |
| Interquartile Range (IQR) | 0.95% | 1.7% |
| Standard Deviation (Sample) | 0.72% | 3.4% |
| Standard Deviation (Population) | 0.72% | 3.3% |
Similar Demographics by Vision Disability
Demographics Similar to Senegalese by Vision Disability
In terms of vision disability, the demographic groups most similar to Senegalese are Ute (2.4%, a difference of 0.090%), Mexican American Indian (2.4%, a difference of 0.10%), Immigrants from Jamaica (2.4%, a difference of 0.14%), Immigrants from Liberia (2.4%, a difference of 0.16%), and Celtic (2.4%, a difference of 0.27%).
| Demographics | Rating | Rank | Vision Disability |
| Fijians | 0.1 /100 | #261 | Tragic 2.4% |
| Jamaicans | 0.1 /100 | #262 | Tragic 2.4% |
| Immigrants | Belize | 0.1 /100 | #263 | Tragic 2.4% |
| Immigrants | Liberia | 0.1 /100 | #264 | Tragic 2.4% |
| Immigrants | Jamaica | 0.1 /100 | #265 | Tragic 2.4% |
| Mexican American Indians | 0.1 /100 | #266 | Tragic 2.4% |
| Ute | 0.1 /100 | #267 | Tragic 2.4% |
| Senegalese | 0.1 /100 | #268 | Tragic 2.4% |
| Celtics | 0.1 /100 | #269 | Tragic 2.4% |
| Cubans | 0.1 /100 | #270 | Tragic 2.4% |
| Immigrants | Azores | 0.1 /100 | #271 | Tragic 2.4% |
| Spaniards | 0.1 /100 | #272 | Tragic 2.4% |
| Immigrants | Bahamas | 0.1 /100 | #273 | Tragic 2.4% |
| Immigrants | Latin America | 0.0 /100 | #274 | Tragic 2.4% |
| Chippewa | 0.0 /100 | #275 | Tragic 2.4% |
Demographics Similar to Immigrants from Netherlands by Vision Disability
In terms of vision disability, the demographic groups most similar to Immigrants from Netherlands are Sierra Leonean (2.1%, a difference of 0.010%), Immigrants from Morocco (2.1%, a difference of 0.13%), South American (2.1%, a difference of 0.16%), Immigrants from Sierra Leone (2.1%, a difference of 0.16%), and Ukrainian (2.1%, a difference of 0.26%).
| Demographics | Rating | Rank | Vision Disability |
| Syrians | 87.5 /100 | #133 | Excellent 2.1% |
| Venezuelans | 87.2 /100 | #134 | Excellent 2.1% |
| Vietnamese | 86.7 /100 | #135 | Excellent 2.1% |
| Czechs | 86.3 /100 | #136 | Excellent 2.1% |
| Immigrants | South Eastern Asia | 86.3 /100 | #137 | Excellent 2.1% |
| Arabs | 86.3 /100 | #138 | Excellent 2.1% |
| Immigrants | Morocco | 85.2 /100 | #139 | Excellent 2.1% |
| Immigrants | Netherlands | 84.2 /100 | #140 | Excellent 2.1% |
| Sierra Leoneans | 84.1 /100 | #141 | Excellent 2.1% |
| South Americans | 82.8 /100 | #142 | Excellent 2.1% |
| Immigrants | Sierra Leone | 82.8 /100 | #143 | Excellent 2.1% |
| Ukrainians | 81.9 /100 | #144 | Excellent 2.1% |
| Immigrants | Bosnia and Herzegovina | 81.5 /100 | #145 | Excellent 2.1% |
| Italians | 79.7 /100 | #146 | Good 2.1% |
| Immigrants | Sudan | 78.4 /100 | #147 | Good 2.1% |