Bhutanese vs Immigrants from Korea Vision Disability
COMPARE
Bhutanese
Immigrants from Korea
Vision Disability
Vision Disability Comparison
Bhutanese
Immigrants from Korea
2.0%
VISION DISABILITY
99.8/ 100
METRIC RATING
37th/ 347
METRIC RANK
1.8%
VISION DISABILITY
100.0/ 100
METRIC RATING
12th/ 347
METRIC RANK
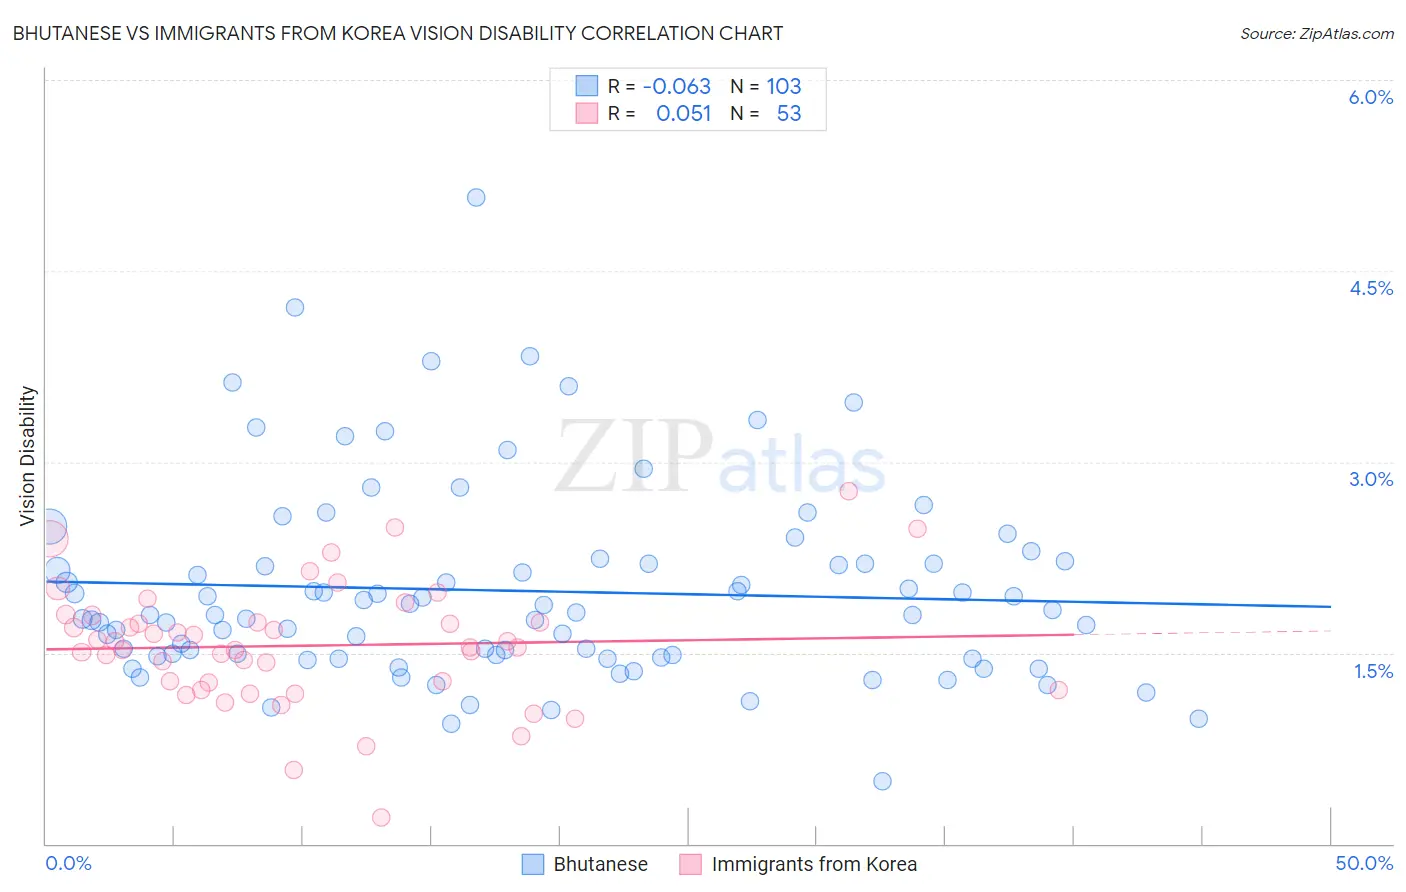
Bhutanese vs Immigrants from Korea Vision Disability Correlation Chart
The statistical analysis conducted on geographies consisting of 454,984,678 people shows a slight negative correlation between the proportion of Bhutanese and percentage of population with vision disability in the United States with a correlation coefficient (R) of -0.063 and weighted average of 2.0%. Similarly, the statistical analysis conducted on geographies consisting of 415,890,370 people shows a slight positive correlation between the proportion of Immigrants from Korea and percentage of population with vision disability in the United States with a correlation coefficient (R) of 0.051 and weighted average of 1.8%, a difference of 7.1%.
Vision Disability Correlation Summary
| Measurement | Bhutanese | Immigrants from Korea |
| Minimum | 0.49% | 0.21% |
| Maximum | 5.1% | 2.8% |
| Range | 4.6% | 2.6% |
| Mean | 2.0% | 1.6% |
| Median | 1.8% | 1.5% |
| Interquartile 25% (IQ1) | 1.5% | 1.2% |
| Interquartile 75% (IQ3) | 2.2% | 1.8% |
| Interquartile Range (IQR) | 0.74% | 0.53% |
| Standard Deviation (Sample) | 0.77% | 0.48% |
| Standard Deviation (Population) | 0.76% | 0.47% |
Similar Demographics by Vision Disability
Demographics Similar to Bhutanese by Vision Disability
In terms of vision disability, the demographic groups most similar to Bhutanese are Immigrants from Kuwait (2.0%, a difference of 0.040%), Zimbabwean (2.0%, a difference of 0.090%), Cambodian (2.0%, a difference of 0.25%), Immigrants from Ireland (2.0%, a difference of 0.29%), and Cypriot (2.0%, a difference of 0.32%).
| Demographics | Rating | Rank | Vision Disability |
| Immigrants | Nepal | 99.9 /100 | #30 | Exceptional 1.9% |
| Mongolians | 99.9 /100 | #31 | Exceptional 1.9% |
| Luxembourgers | 99.9 /100 | #32 | Exceptional 1.9% |
| Immigrants | Egypt | 99.9 /100 | #33 | Exceptional 1.9% |
| Immigrants | Turkey | 99.8 /100 | #34 | Exceptional 1.9% |
| Immigrants | Australia | 99.8 /100 | #35 | Exceptional 1.9% |
| Cambodians | 99.8 /100 | #36 | Exceptional 2.0% |
| Bhutanese | 99.8 /100 | #37 | Exceptional 2.0% |
| Immigrants | Kuwait | 99.8 /100 | #38 | Exceptional 2.0% |
| Zimbabweans | 99.7 /100 | #39 | Exceptional 2.0% |
| Immigrants | Ireland | 99.7 /100 | #40 | Exceptional 2.0% |
| Cypriots | 99.7 /100 | #41 | Exceptional 2.0% |
| Immigrants | Ethiopia | 99.7 /100 | #42 | Exceptional 2.0% |
| Eastern Europeans | 99.7 /100 | #43 | Exceptional 2.0% |
| Immigrants | Indonesia | 99.7 /100 | #44 | Exceptional 2.0% |
Demographics Similar to Immigrants from Korea by Vision Disability
In terms of vision disability, the demographic groups most similar to Immigrants from Korea are Immigrants from Eastern Asia (1.8%, a difference of 0.080%), Immigrants from China (1.8%, a difference of 0.22%), Immigrants from Israel (1.8%, a difference of 0.23%), Immigrants from Bolivia (1.8%, a difference of 0.65%), and Indian (Asian) (1.8%, a difference of 1.1%).
| Demographics | Rating | Rank | Vision Disability |
| Okinawans | 100.0 /100 | #5 | Exceptional 1.8% |
| Immigrants | Iran | 100.0 /100 | #6 | Exceptional 1.8% |
| Immigrants | South Central Asia | 100.0 /100 | #7 | Exceptional 1.8% |
| Iranians | 100.0 /100 | #8 | Exceptional 1.8% |
| Immigrants | Singapore | 100.0 /100 | #9 | Exceptional 1.8% |
| Immigrants | Hong Kong | 100.0 /100 | #10 | Exceptional 1.8% |
| Immigrants | Israel | 100.0 /100 | #11 | Exceptional 1.8% |
| Immigrants | Korea | 100.0 /100 | #12 | Exceptional 1.8% |
| Immigrants | Eastern Asia | 100.0 /100 | #13 | Exceptional 1.8% |
| Immigrants | China | 100.0 /100 | #14 | Exceptional 1.8% |
| Immigrants | Bolivia | 100.0 /100 | #15 | Exceptional 1.8% |
| Indians (Asian) | 100.0 /100 | #16 | Exceptional 1.8% |
| Burmese | 100.0 /100 | #17 | Exceptional 1.8% |
| Bolivians | 100.0 /100 | #18 | Exceptional 1.9% |
| Immigrants | Sri Lanka | 100.0 /100 | #19 | Exceptional 1.9% |