Bhutanese vs Inupiat Vision Disability
COMPARE
Bhutanese
Inupiat
Vision Disability
Vision Disability Comparison
Bhutanese
Inupiat
2.0%
VISION DISABILITY
99.8/ 100
METRIC RATING
37th/ 347
METRIC RANK
2.7%
VISION DISABILITY
0.0/ 100
METRIC RATING
314th/ 347
METRIC RANK
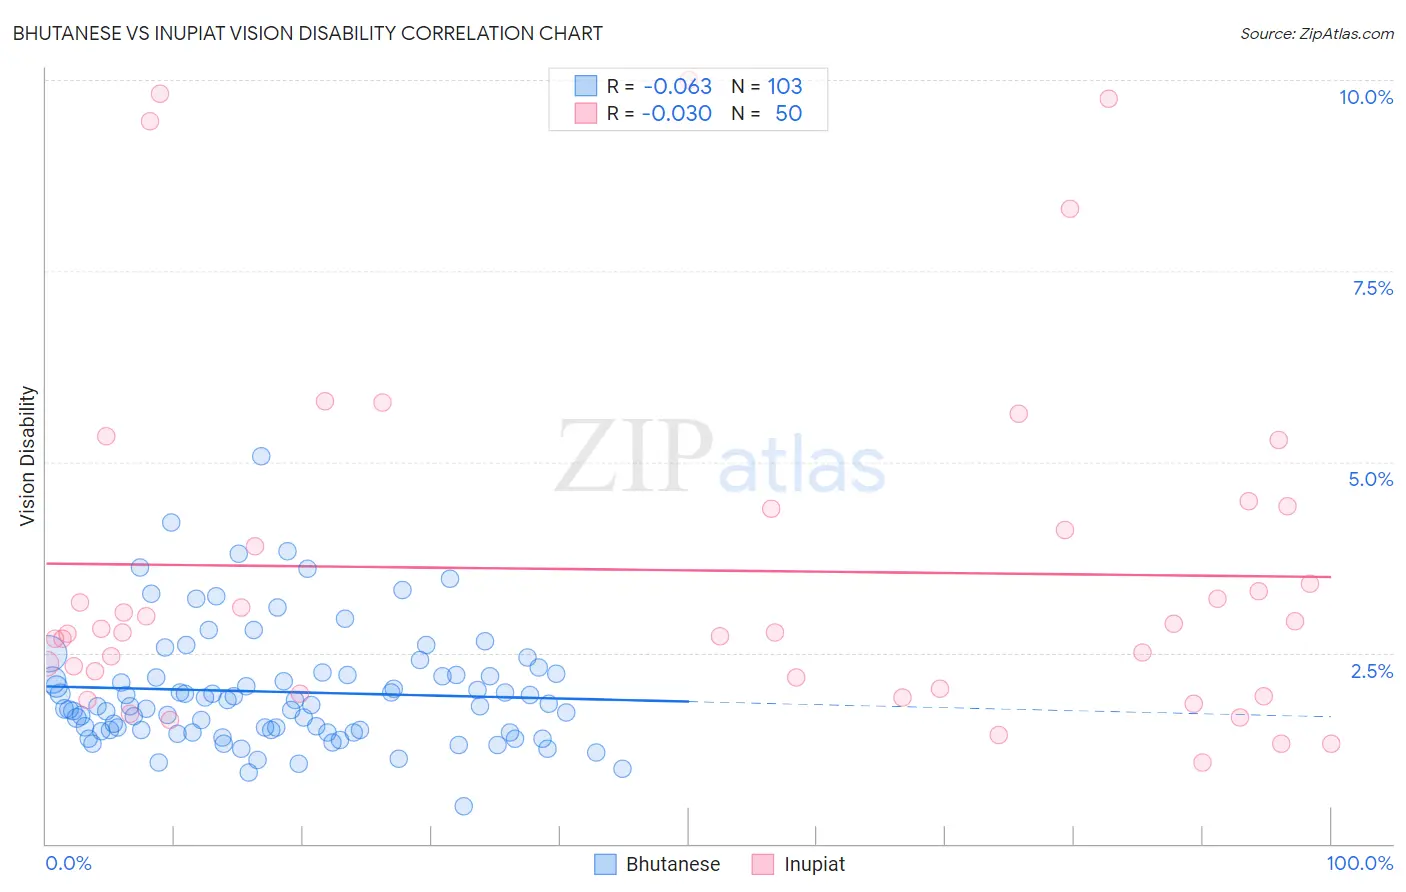
Bhutanese vs Inupiat Vision Disability Correlation Chart
The statistical analysis conducted on geographies consisting of 454,984,678 people shows a slight negative correlation between the proportion of Bhutanese and percentage of population with vision disability in the United States with a correlation coefficient (R) of -0.063 and weighted average of 2.0%. Similarly, the statistical analysis conducted on geographies consisting of 96,318,866 people shows no correlation between the proportion of Inupiat and percentage of population with vision disability in the United States with a correlation coefficient (R) of -0.030 and weighted average of 2.7%, a difference of 35.2%.
Vision Disability Correlation Summary
| Measurement | Bhutanese | Inupiat |
| Minimum | 0.49% | 1.1% |
| Maximum | 5.1% | 10.0% |
| Range | 4.6% | 8.9% |
| Mean | 2.0% | 3.6% |
| Median | 1.8% | 2.8% |
| Interquartile 25% (IQ1) | 1.5% | 2.0% |
| Interquartile 75% (IQ3) | 2.2% | 4.4% |
| Interquartile Range (IQR) | 0.74% | 2.4% |
| Standard Deviation (Sample) | 0.77% | 2.3% |
| Standard Deviation (Population) | 0.76% | 2.3% |
Similar Demographics by Vision Disability
Demographics Similar to Bhutanese by Vision Disability
In terms of vision disability, the demographic groups most similar to Bhutanese are Immigrants from Kuwait (2.0%, a difference of 0.040%), Zimbabwean (2.0%, a difference of 0.090%), Cambodian (2.0%, a difference of 0.25%), Immigrants from Ireland (2.0%, a difference of 0.29%), and Cypriot (2.0%, a difference of 0.32%).
| Demographics | Rating | Rank | Vision Disability |
| Immigrants | Nepal | 99.9 /100 | #30 | Exceptional 1.9% |
| Mongolians | 99.9 /100 | #31 | Exceptional 1.9% |
| Luxembourgers | 99.9 /100 | #32 | Exceptional 1.9% |
| Immigrants | Egypt | 99.9 /100 | #33 | Exceptional 1.9% |
| Immigrants | Turkey | 99.8 /100 | #34 | Exceptional 1.9% |
| Immigrants | Australia | 99.8 /100 | #35 | Exceptional 1.9% |
| Cambodians | 99.8 /100 | #36 | Exceptional 2.0% |
| Bhutanese | 99.8 /100 | #37 | Exceptional 2.0% |
| Immigrants | Kuwait | 99.8 /100 | #38 | Exceptional 2.0% |
| Zimbabweans | 99.7 /100 | #39 | Exceptional 2.0% |
| Immigrants | Ireland | 99.7 /100 | #40 | Exceptional 2.0% |
| Cypriots | 99.7 /100 | #41 | Exceptional 2.0% |
| Immigrants | Ethiopia | 99.7 /100 | #42 | Exceptional 2.0% |
| Eastern Europeans | 99.7 /100 | #43 | Exceptional 2.0% |
| Immigrants | Indonesia | 99.7 /100 | #44 | Exceptional 2.0% |
Demographics Similar to Inupiat by Vision Disability
In terms of vision disability, the demographic groups most similar to Inupiat are Potawatomi (2.6%, a difference of 0.070%), American (2.6%, a difference of 0.080%), Dominican (2.6%, a difference of 0.91%), Blackfeet (2.6%, a difference of 0.95%), and Osage (2.7%, a difference of 1.2%).
| Demographics | Rating | Rank | Vision Disability |
| Immigrants | Dominican Republic | 0.0 /100 | #307 | Tragic 2.6% |
| Arapaho | 0.0 /100 | #308 | Tragic 2.6% |
| Immigrants | Yemen | 0.0 /100 | #309 | Tragic 2.6% |
| Blackfeet | 0.0 /100 | #310 | Tragic 2.6% |
| Dominicans | 0.0 /100 | #311 | Tragic 2.6% |
| Americans | 0.0 /100 | #312 | Tragic 2.6% |
| Potawatomi | 0.0 /100 | #313 | Tragic 2.6% |
| Inupiat | 0.0 /100 | #314 | Tragic 2.7% |
| Osage | 0.0 /100 | #315 | Tragic 2.7% |
| Shoshone | 0.0 /100 | #316 | Tragic 2.7% |
| Yup'ik | 0.0 /100 | #317 | Tragic 2.7% |
| Alaska Natives | 0.0 /100 | #318 | Tragic 2.7% |
| Tohono O'odham | 0.0 /100 | #319 | Tragic 2.8% |
| Blacks/African Americans | 0.0 /100 | #320 | Tragic 2.8% |
| Comanche | 0.0 /100 | #321 | Tragic 2.8% |