Belizean vs Crow Vision Disability
COMPARE
Belizean
Crow
Vision Disability
Vision Disability Comparison
Belizeans
Crow
2.4%
VISION DISABILITY
0.2/ 100
METRIC RATING
260th/ 347
METRIC RANK
2.5%
VISION DISABILITY
0.0/ 100
METRIC RATING
292nd/ 347
METRIC RANK
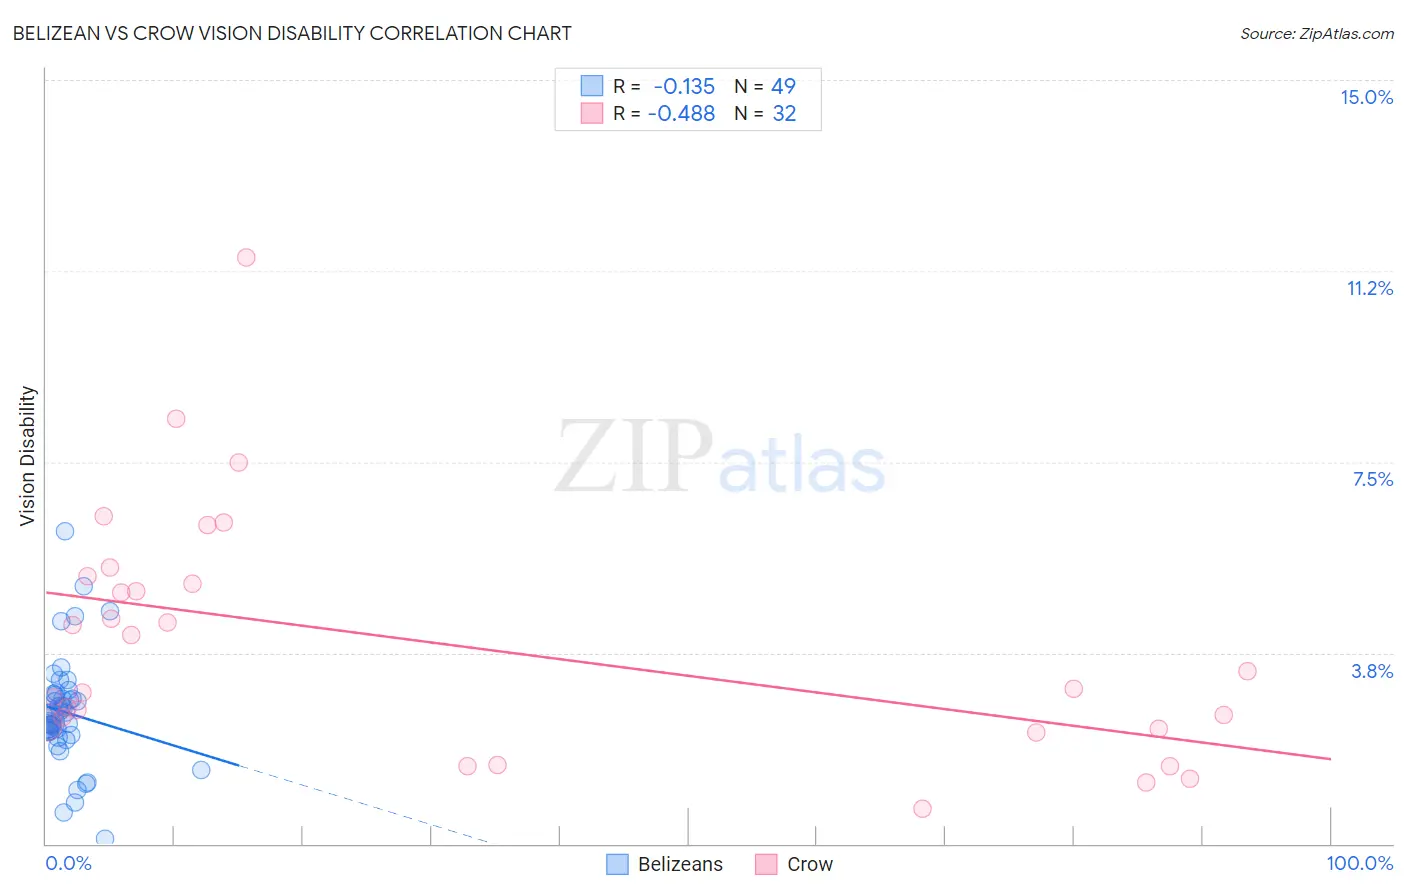
Belizean vs Crow Vision Disability Correlation Chart
The statistical analysis conducted on geographies consisting of 144,166,801 people shows a poor negative correlation between the proportion of Belizeans and percentage of population with vision disability in the United States with a correlation coefficient (R) of -0.135 and weighted average of 2.4%. Similarly, the statistical analysis conducted on geographies consisting of 59,186,790 people shows a moderate negative correlation between the proportion of Crow and percentage of population with vision disability in the United States with a correlation coefficient (R) of -0.488 and weighted average of 2.5%, a difference of 4.7%.
Vision Disability Correlation Summary
| Measurement | Belizean | Crow |
| Minimum | 0.11% | 0.69% |
| Maximum | 6.1% | 11.5% |
| Range | 6.0% | 10.8% |
| Mean | 2.6% | 3.9% |
| Median | 2.6% | 3.2% |
| Interquartile 25% (IQ1) | 2.2% | 2.3% |
| Interquartile 75% (IQ3) | 2.9% | 5.2% |
| Interquartile Range (IQR) | 0.76% | 2.9% |
| Standard Deviation (Sample) | 1.1% | 2.4% |
| Standard Deviation (Population) | 1.1% | 2.3% |
Similar Demographics by Vision Disability
Demographics Similar to Belizeans by Vision Disability
In terms of vision disability, the demographic groups most similar to Belizeans are White/Caucasian (2.4%, a difference of 0.17%), British West Indian (2.4%, a difference of 0.18%), West Indian (2.4%, a difference of 0.21%), Fijian (2.4%, a difference of 0.21%), and Jamaican (2.4%, a difference of 0.24%).
| Demographics | Rating | Rank | Vision Disability |
| Japanese | 0.3 /100 | #253 | Tragic 2.4% |
| Haitians | 0.3 /100 | #254 | Tragic 2.4% |
| Immigrants | Guatemala | 0.3 /100 | #255 | Tragic 2.4% |
| Immigrants | Haiti | 0.2 /100 | #256 | Tragic 2.4% |
| West Indians | 0.2 /100 | #257 | Tragic 2.4% |
| British West Indians | 0.2 /100 | #258 | Tragic 2.4% |
| Whites/Caucasians | 0.2 /100 | #259 | Tragic 2.4% |
| Belizeans | 0.2 /100 | #260 | Tragic 2.4% |
| Fijians | 0.1 /100 | #261 | Tragic 2.4% |
| Jamaicans | 0.1 /100 | #262 | Tragic 2.4% |
| Immigrants | Belize | 0.1 /100 | #263 | Tragic 2.4% |
| Immigrants | Liberia | 0.1 /100 | #264 | Tragic 2.4% |
| Immigrants | Jamaica | 0.1 /100 | #265 | Tragic 2.4% |
| Mexican American Indians | 0.1 /100 | #266 | Tragic 2.4% |
| Ute | 0.1 /100 | #267 | Tragic 2.4% |
Demographics Similar to Crow by Vision Disability
In terms of vision disability, the demographic groups most similar to Crow are Yaqui (2.5%, a difference of 0.030%), Immigrants from Honduras (2.5%, a difference of 0.10%), Ottawa (2.5%, a difference of 0.36%), Immigrants from Cuba (2.5%, a difference of 0.49%), and Delaware (2.5%, a difference of 0.58%).
| Demographics | Rating | Rank | Vision Disability |
| Immigrants | Central America | 0.0 /100 | #285 | Tragic 2.5% |
| Sioux | 0.0 /100 | #286 | Tragic 2.5% |
| Hondurans | 0.0 /100 | #287 | Tragic 2.5% |
| French American Indians | 0.0 /100 | #288 | Tragic 2.5% |
| Immigrants | Nonimmigrants | 0.0 /100 | #289 | Tragic 2.5% |
| Immigrants | Cuba | 0.0 /100 | #290 | Tragic 2.5% |
| Immigrants | Honduras | 0.0 /100 | #291 | Tragic 2.5% |
| Crow | 0.0 /100 | #292 | Tragic 2.5% |
| Yaqui | 0.0 /100 | #293 | Tragic 2.5% |
| Ottawa | 0.0 /100 | #294 | Tragic 2.5% |
| Delaware | 0.0 /100 | #295 | Tragic 2.5% |
| Immigrants | Mexico | 0.0 /100 | #296 | Tragic 2.5% |
| Immigrants | Dominica | 0.0 /100 | #297 | Tragic 2.5% |
| Mexicans | 0.0 /100 | #298 | Tragic 2.5% |
| Cree | 0.0 /100 | #299 | Tragic 2.5% |