Belizean vs Dutch West Indian Vision Disability
COMPARE
Belizean
Dutch West Indian
Vision Disability
Vision Disability Comparison
Belizeans
Dutch West Indians
2.4%
VISION DISABILITY
0.2/ 100
METRIC RATING
260th/ 347
METRIC RANK
3.2%
VISION DISABILITY
0.0/ 100
METRIC RATING
337th/ 347
METRIC RANK
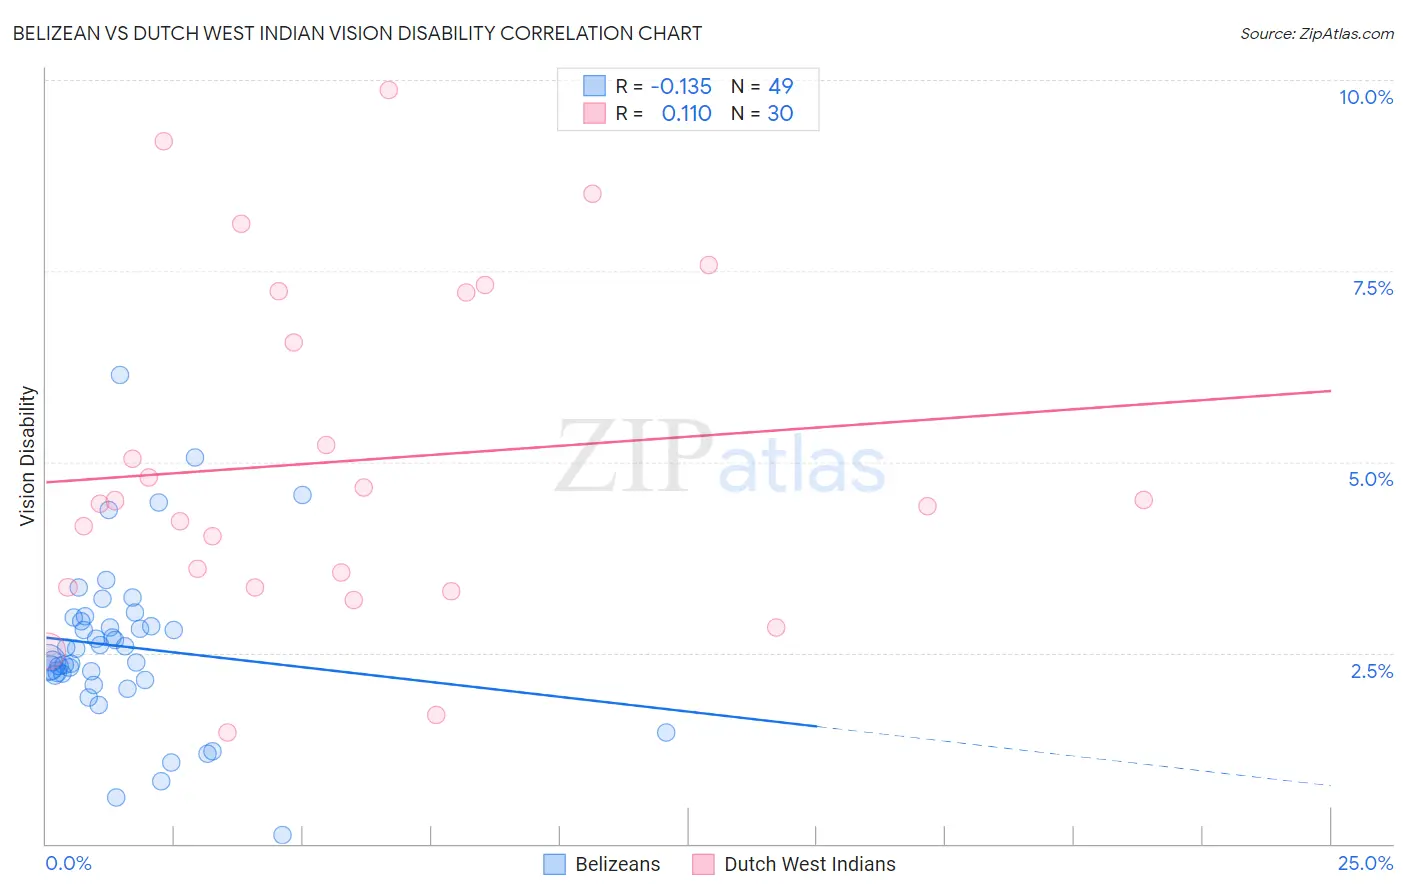
Belizean vs Dutch West Indian Vision Disability Correlation Chart
The statistical analysis conducted on geographies consisting of 144,166,801 people shows a poor negative correlation between the proportion of Belizeans and percentage of population with vision disability in the United States with a correlation coefficient (R) of -0.135 and weighted average of 2.4%. Similarly, the statistical analysis conducted on geographies consisting of 85,756,307 people shows a poor positive correlation between the proportion of Dutch West Indians and percentage of population with vision disability in the United States with a correlation coefficient (R) of 0.110 and weighted average of 3.2%, a difference of 32.2%.
Vision Disability Correlation Summary
| Measurement | Belizean | Dutch West Indian |
| Minimum | 0.11% | 1.5% |
| Maximum | 6.1% | 9.9% |
| Range | 6.0% | 8.4% |
| Mean | 2.6% | 5.0% |
| Median | 2.6% | 4.5% |
| Interquartile 25% (IQ1) | 2.2% | 3.4% |
| Interquartile 75% (IQ3) | 2.9% | 7.2% |
| Interquartile Range (IQR) | 0.76% | 3.8% |
| Standard Deviation (Sample) | 1.1% | 2.2% |
| Standard Deviation (Population) | 1.1% | 2.2% |
Similar Demographics by Vision Disability
Demographics Similar to Belizeans by Vision Disability
In terms of vision disability, the demographic groups most similar to Belizeans are White/Caucasian (2.4%, a difference of 0.17%), British West Indian (2.4%, a difference of 0.18%), West Indian (2.4%, a difference of 0.21%), Fijian (2.4%, a difference of 0.21%), and Jamaican (2.4%, a difference of 0.24%).
| Demographics | Rating | Rank | Vision Disability |
| Japanese | 0.3 /100 | #253 | Tragic 2.4% |
| Haitians | 0.3 /100 | #254 | Tragic 2.4% |
| Immigrants | Guatemala | 0.3 /100 | #255 | Tragic 2.4% |
| Immigrants | Haiti | 0.2 /100 | #256 | Tragic 2.4% |
| West Indians | 0.2 /100 | #257 | Tragic 2.4% |
| British West Indians | 0.2 /100 | #258 | Tragic 2.4% |
| Whites/Caucasians | 0.2 /100 | #259 | Tragic 2.4% |
| Belizeans | 0.2 /100 | #260 | Tragic 2.4% |
| Fijians | 0.1 /100 | #261 | Tragic 2.4% |
| Jamaicans | 0.1 /100 | #262 | Tragic 2.4% |
| Immigrants | Belize | 0.1 /100 | #263 | Tragic 2.4% |
| Immigrants | Liberia | 0.1 /100 | #264 | Tragic 2.4% |
| Immigrants | Jamaica | 0.1 /100 | #265 | Tragic 2.4% |
| Mexican American Indians | 0.1 /100 | #266 | Tragic 2.4% |
| Ute | 0.1 /100 | #267 | Tragic 2.4% |
Demographics Similar to Dutch West Indians by Vision Disability
In terms of vision disability, the demographic groups most similar to Dutch West Indians are Alaskan Athabascan (3.1%, a difference of 0.030%), Navajo (3.1%, a difference of 0.19%), Chickasaw (3.2%, a difference of 0.91%), Tsimshian (3.2%, a difference of 1.6%), and Creek (3.2%, a difference of 1.7%).
| Demographics | Rating | Rank | Vision Disability |
| Colville | 0.0 /100 | #330 | Tragic 3.0% |
| Central American Indians | 0.0 /100 | #331 | Tragic 3.0% |
| Seminole | 0.0 /100 | #332 | Tragic 3.1% |
| Cajuns | 0.0 /100 | #333 | Tragic 3.1% |
| Cheyenne | 0.0 /100 | #334 | Tragic 3.1% |
| Navajo | 0.0 /100 | #335 | Tragic 3.1% |
| Alaskan Athabascans | 0.0 /100 | #336 | Tragic 3.1% |
| Dutch West Indians | 0.0 /100 | #337 | Tragic 3.2% |
| Chickasaw | 0.0 /100 | #338 | Tragic 3.2% |
| Tsimshian | 0.0 /100 | #339 | Tragic 3.2% |
| Creek | 0.0 /100 | #340 | Tragic 3.2% |
| Kiowa | 0.0 /100 | #341 | Tragic 3.3% |
| Choctaw | 0.0 /100 | #342 | Tragic 3.3% |
| Pima | 0.0 /100 | #343 | Tragic 3.3% |
| Pueblo | 0.0 /100 | #344 | Tragic 3.3% |