Belizean vs Kenyan Vision Disability
COMPARE
Belizean
Kenyan
Vision Disability
Vision Disability Comparison
Belizeans
Kenyans
2.4%
VISION DISABILITY
0.2/ 100
METRIC RATING
260th/ 347
METRIC RANK
2.1%
VISION DISABILITY
92.5/ 100
METRIC RATING
113th/ 347
METRIC RANK
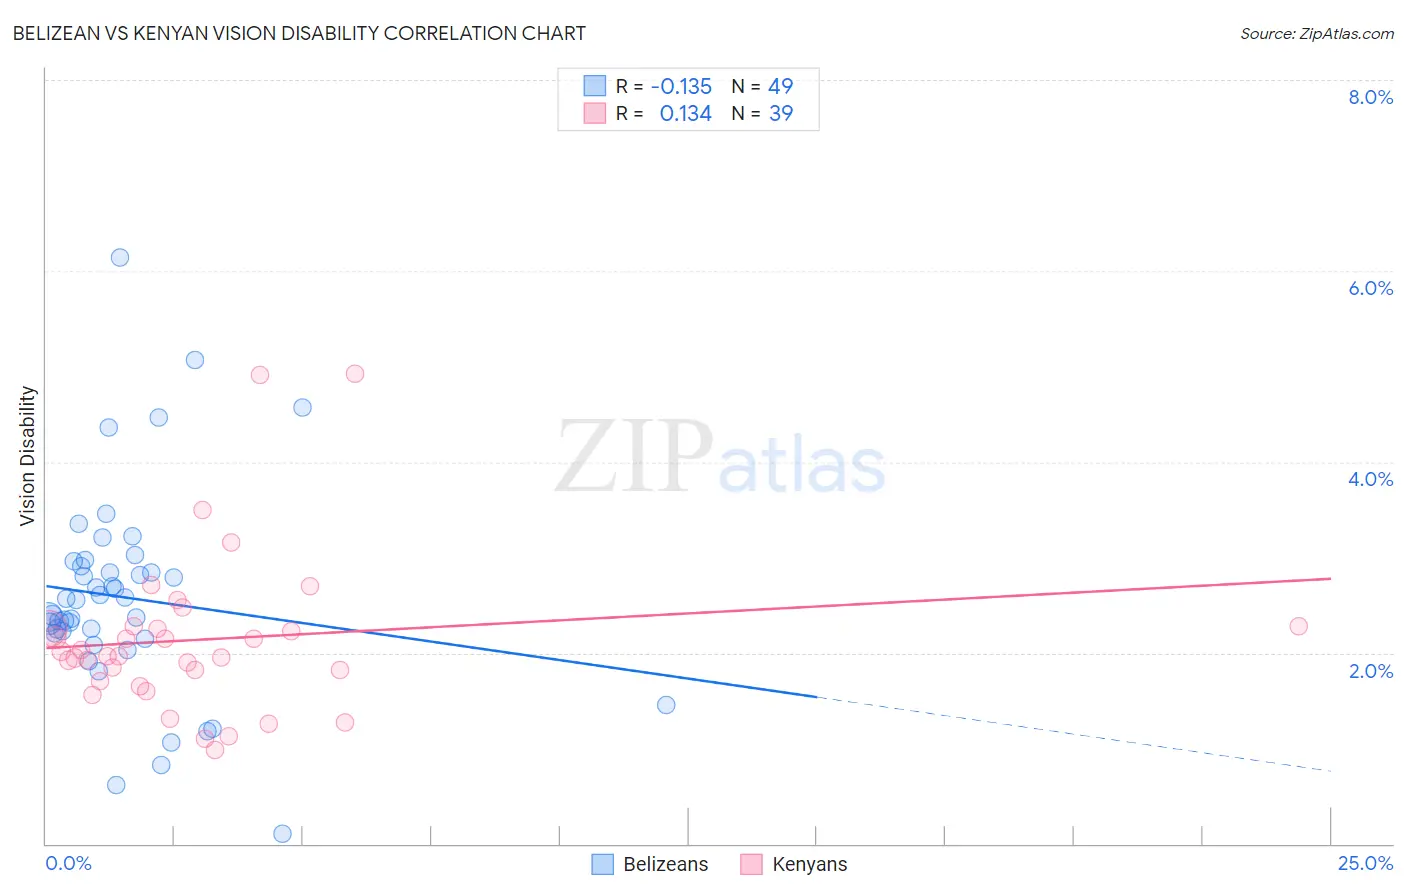
Belizean vs Kenyan Vision Disability Correlation Chart
The statistical analysis conducted on geographies consisting of 144,166,801 people shows a poor negative correlation between the proportion of Belizeans and percentage of population with vision disability in the United States with a correlation coefficient (R) of -0.135 and weighted average of 2.4%. Similarly, the statistical analysis conducted on geographies consisting of 168,152,432 people shows a poor positive correlation between the proportion of Kenyans and percentage of population with vision disability in the United States with a correlation coefficient (R) of 0.134 and weighted average of 2.1%, a difference of 14.5%.
Vision Disability Correlation Summary
| Measurement | Belizean | Kenyan |
| Minimum | 0.11% | 0.99% |
| Maximum | 6.1% | 4.9% |
| Range | 6.0% | 3.9% |
| Mean | 2.6% | 2.1% |
| Median | 2.6% | 2.0% |
| Interquartile 25% (IQ1) | 2.2% | 1.7% |
| Interquartile 75% (IQ3) | 2.9% | 2.3% |
| Interquartile Range (IQR) | 0.76% | 0.58% |
| Standard Deviation (Sample) | 1.1% | 0.84% |
| Standard Deviation (Population) | 1.1% | 0.83% |
Similar Demographics by Vision Disability
Demographics Similar to Belizeans by Vision Disability
In terms of vision disability, the demographic groups most similar to Belizeans are White/Caucasian (2.4%, a difference of 0.17%), British West Indian (2.4%, a difference of 0.18%), West Indian (2.4%, a difference of 0.21%), Fijian (2.4%, a difference of 0.21%), and Jamaican (2.4%, a difference of 0.24%).
| Demographics | Rating | Rank | Vision Disability |
| Japanese | 0.3 /100 | #253 | Tragic 2.4% |
| Haitians | 0.3 /100 | #254 | Tragic 2.4% |
| Immigrants | Guatemala | 0.3 /100 | #255 | Tragic 2.4% |
| Immigrants | Haiti | 0.2 /100 | #256 | Tragic 2.4% |
| West Indians | 0.2 /100 | #257 | Tragic 2.4% |
| British West Indians | 0.2 /100 | #258 | Tragic 2.4% |
| Whites/Caucasians | 0.2 /100 | #259 | Tragic 2.4% |
| Belizeans | 0.2 /100 | #260 | Tragic 2.4% |
| Fijians | 0.1 /100 | #261 | Tragic 2.4% |
| Jamaicans | 0.1 /100 | #262 | Tragic 2.4% |
| Immigrants | Belize | 0.1 /100 | #263 | Tragic 2.4% |
| Immigrants | Liberia | 0.1 /100 | #264 | Tragic 2.4% |
| Immigrants | Jamaica | 0.1 /100 | #265 | Tragic 2.4% |
| Mexican American Indians | 0.1 /100 | #266 | Tragic 2.4% |
| Ute | 0.1 /100 | #267 | Tragic 2.4% |
Demographics Similar to Kenyans by Vision Disability
In terms of vision disability, the demographic groups most similar to Kenyans are Croatian (2.1%, a difference of 0.030%), Immigrants from Vietnam (2.1%, a difference of 0.060%), Ugandan (2.1%, a difference of 0.060%), Polish (2.1%, a difference of 0.11%), and Immigrants from Denmark (2.1%, a difference of 0.12%).
| Demographics | Rating | Rank | Vision Disability |
| Swedes | 94.2 /100 | #106 | Exceptional 2.1% |
| Danes | 94.2 /100 | #107 | Exceptional 2.1% |
| Koreans | 94.1 /100 | #108 | Exceptional 2.1% |
| Chileans | 94.0 /100 | #109 | Exceptional 2.1% |
| Immigrants | Armenia | 93.8 /100 | #110 | Exceptional 2.1% |
| Peruvians | 93.5 /100 | #111 | Exceptional 2.1% |
| Immigrants | Denmark | 92.9 /100 | #112 | Exceptional 2.1% |
| Kenyans | 92.5 /100 | #113 | Exceptional 2.1% |
| Croatians | 92.3 /100 | #114 | Exceptional 2.1% |
| Immigrants | Vietnam | 92.2 /100 | #115 | Exceptional 2.1% |
| Ugandans | 92.2 /100 | #116 | Exceptional 2.1% |
| Poles | 92.0 /100 | #117 | Exceptional 2.1% |
| Immigrants | Philippines | 91.4 /100 | #118 | Exceptional 2.1% |
| Immigrants | Uganda | 91.4 /100 | #119 | Exceptional 2.1% |
| Immigrants | Zimbabwe | 91.0 /100 | #120 | Exceptional 2.1% |