Belizean vs Latvian Vision Disability
COMPARE
Belizean
Latvian
Vision Disability
Vision Disability Comparison
Belizeans
Latvians
2.4%
VISION DISABILITY
0.2/ 100
METRIC RATING
260th/ 347
METRIC RANK
2.0%
VISION DISABILITY
99.5/ 100
METRIC RATING
49th/ 347
METRIC RANK
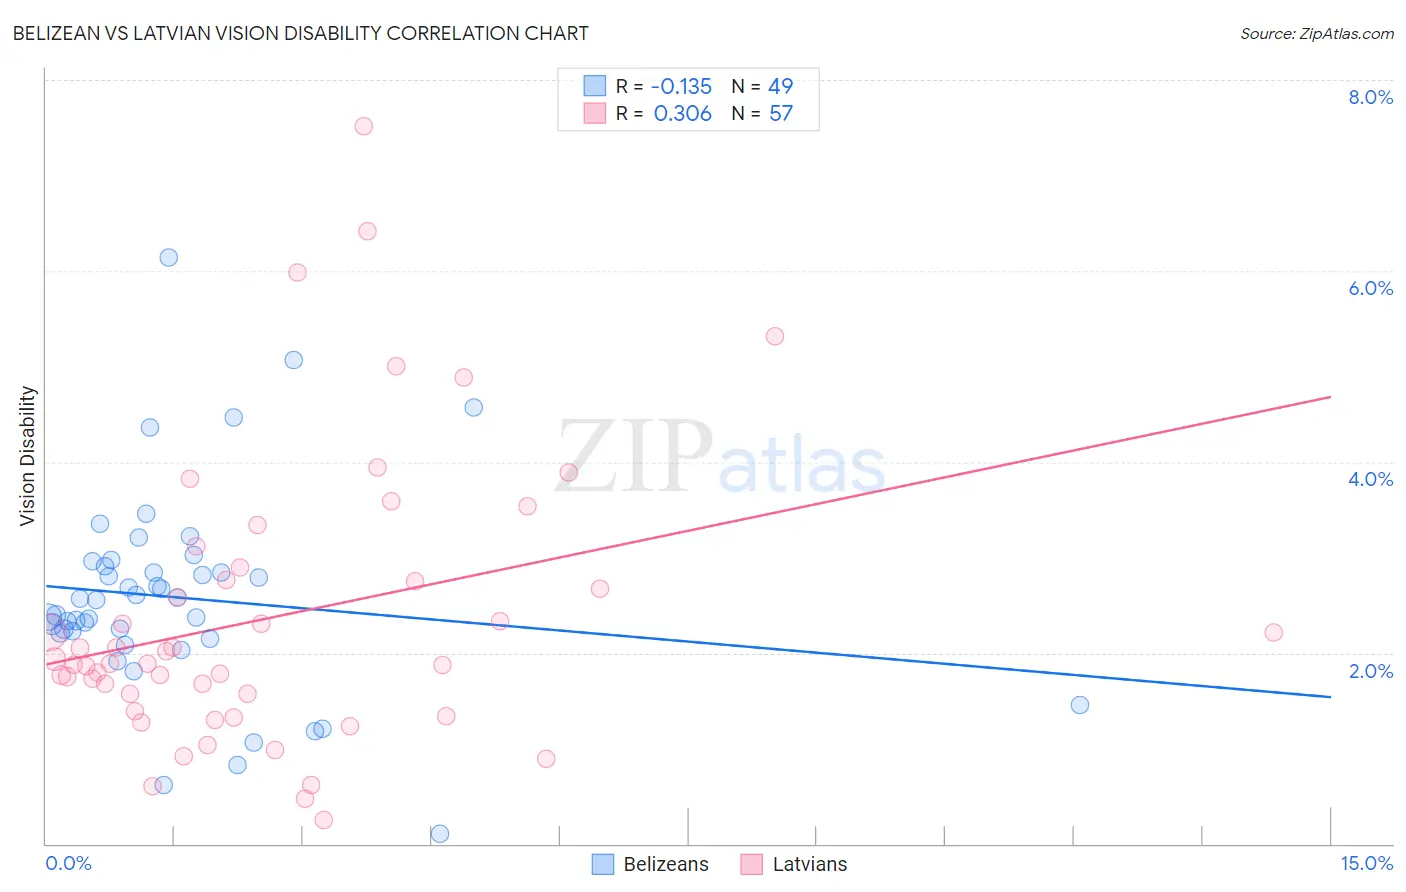
Belizean vs Latvian Vision Disability Correlation Chart
The statistical analysis conducted on geographies consisting of 144,166,801 people shows a poor negative correlation between the proportion of Belizeans and percentage of population with vision disability in the United States with a correlation coefficient (R) of -0.135 and weighted average of 2.4%. Similarly, the statistical analysis conducted on geographies consisting of 220,626,631 people shows a mild positive correlation between the proportion of Latvians and percentage of population with vision disability in the United States with a correlation coefficient (R) of 0.306 and weighted average of 2.0%, a difference of 20.1%.
Vision Disability Correlation Summary
| Measurement | Belizean | Latvian |
| Minimum | 0.11% | 0.25% |
| Maximum | 6.1% | 7.5% |
| Range | 6.0% | 7.3% |
| Mean | 2.6% | 2.4% |
| Median | 2.6% | 1.9% |
| Interquartile 25% (IQ1) | 2.2% | 1.5% |
| Interquartile 75% (IQ3) | 2.9% | 2.8% |
| Interquartile Range (IQR) | 0.76% | 1.3% |
| Standard Deviation (Sample) | 1.1% | 1.5% |
| Standard Deviation (Population) | 1.1% | 1.5% |
Similar Demographics by Vision Disability
Demographics Similar to Belizeans by Vision Disability
In terms of vision disability, the demographic groups most similar to Belizeans are White/Caucasian (2.4%, a difference of 0.17%), British West Indian (2.4%, a difference of 0.18%), West Indian (2.4%, a difference of 0.21%), Fijian (2.4%, a difference of 0.21%), and Jamaican (2.4%, a difference of 0.24%).
| Demographics | Rating | Rank | Vision Disability |
| Japanese | 0.3 /100 | #253 | Tragic 2.4% |
| Haitians | 0.3 /100 | #254 | Tragic 2.4% |
| Immigrants | Guatemala | 0.3 /100 | #255 | Tragic 2.4% |
| Immigrants | Haiti | 0.2 /100 | #256 | Tragic 2.4% |
| West Indians | 0.2 /100 | #257 | Tragic 2.4% |
| British West Indians | 0.2 /100 | #258 | Tragic 2.4% |
| Whites/Caucasians | 0.2 /100 | #259 | Tragic 2.4% |
| Belizeans | 0.2 /100 | #260 | Tragic 2.4% |
| Fijians | 0.1 /100 | #261 | Tragic 2.4% |
| Jamaicans | 0.1 /100 | #262 | Tragic 2.4% |
| Immigrants | Belize | 0.1 /100 | #263 | Tragic 2.4% |
| Immigrants | Liberia | 0.1 /100 | #264 | Tragic 2.4% |
| Immigrants | Jamaica | 0.1 /100 | #265 | Tragic 2.4% |
| Mexican American Indians | 0.1 /100 | #266 | Tragic 2.4% |
| Ute | 0.1 /100 | #267 | Tragic 2.4% |
Demographics Similar to Latvians by Vision Disability
In terms of vision disability, the demographic groups most similar to Latvians are Afghan (2.0%, a difference of 0.060%), Israeli (2.0%, a difference of 0.070%), Tongan (2.0%, a difference of 0.15%), Immigrants from Serbia (2.0%, a difference of 0.46%), and Immigrants from Bulgaria (2.0%, a difference of 0.52%).
| Demographics | Rating | Rank | Vision Disability |
| Immigrants | Ethiopia | 99.7 /100 | #42 | Exceptional 2.0% |
| Eastern Europeans | 99.7 /100 | #43 | Exceptional 2.0% |
| Immigrants | Indonesia | 99.7 /100 | #44 | Exceptional 2.0% |
| Ethiopians | 99.7 /100 | #45 | Exceptional 2.0% |
| Immigrants | Sweden | 99.7 /100 | #46 | Exceptional 2.0% |
| Immigrants | Bulgaria | 99.7 /100 | #47 | Exceptional 2.0% |
| Israelis | 99.6 /100 | #48 | Exceptional 2.0% |
| Latvians | 99.5 /100 | #49 | Exceptional 2.0% |
| Afghans | 99.5 /100 | #50 | Exceptional 2.0% |
| Tongans | 99.5 /100 | #51 | Exceptional 2.0% |
| Immigrants | Serbia | 99.4 /100 | #52 | Exceptional 2.0% |
| Immigrants | Belarus | 99.3 /100 | #53 | Exceptional 2.0% |
| Macedonians | 99.3 /100 | #54 | Exceptional 2.0% |
| Laotians | 99.3 /100 | #55 | Exceptional 2.0% |
| Jordanians | 99.2 /100 | #56 | Exceptional 2.0% |