Belgian vs Ethiopian Unemployment Among Ages 20 to 24 years
COMPARE
Belgian
Ethiopian
Unemployment Among Ages 20 to 24 years
Unemployment Among Ages 20 to 24 years Comparison
Belgians
Ethiopians
9.6%
UNEMPLOYMENT AMONG AGES 20 TO 24 YEARS
100.0/ 100
METRIC RATING
36th/ 347
METRIC RANK
9.8%
UNEMPLOYMENT AMONG AGES 20 TO 24 YEARS
99.7/ 100
METRIC RATING
51st/ 347
METRIC RANK
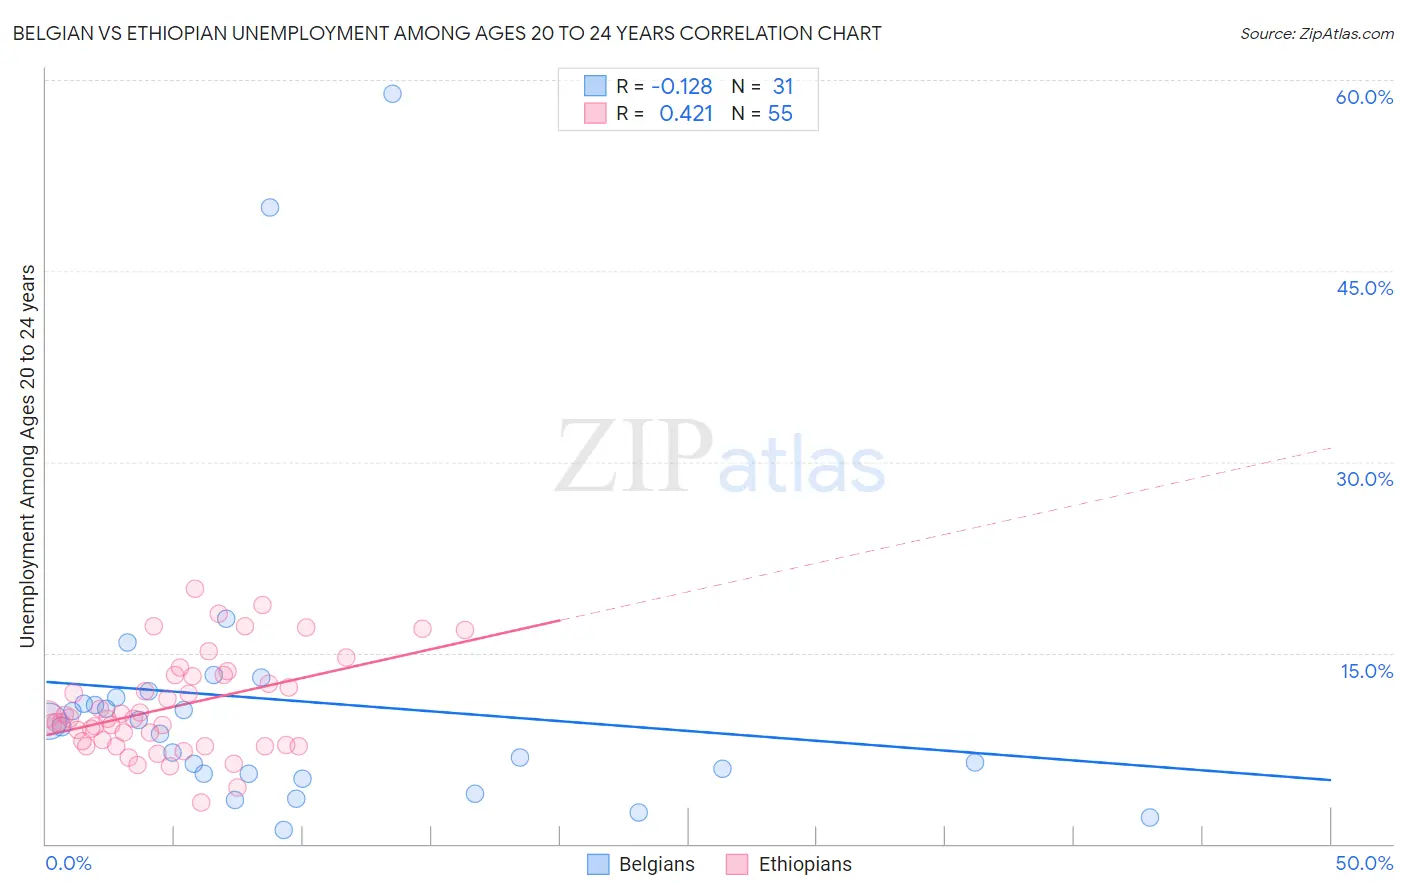
Belgian vs Ethiopian Unemployment Among Ages 20 to 24 years Correlation Chart
The statistical analysis conducted on geographies consisting of 342,879,966 people shows a poor negative correlation between the proportion of Belgians and unemployment rate among population between the ages 20 and 24 in the United States with a correlation coefficient (R) of -0.128 and weighted average of 9.6%. Similarly, the statistical analysis conducted on geographies consisting of 220,623,772 people shows a moderate positive correlation between the proportion of Ethiopians and unemployment rate among population between the ages 20 and 24 in the United States with a correlation coefficient (R) of 0.421 and weighted average of 9.8%, a difference of 1.8%.
Unemployment Among Ages 20 to 24 years Correlation Summary
| Measurement | Belgian | Ethiopian |
| Minimum | 1.1% | 3.2% |
| Maximum | 58.9% | 20.0% |
| Range | 57.8% | 16.8% |
| Mean | 11.2% | 10.8% |
| Median | 9.2% | 9.8% |
| Interquartile 25% (IQ1) | 5.5% | 7.8% |
| Interquartile 75% (IQ3) | 11.5% | 13.3% |
| Interquartile Range (IQR) | 6.0% | 5.5% |
| Standard Deviation (Sample) | 12.3% | 3.8% |
| Standard Deviation (Population) | 12.1% | 3.8% |
Demographics Similar to Belgians and Ethiopians by Unemployment Among Ages 20 to 24 years
In terms of unemployment among ages 20 to 24 years, the demographic groups most similar to Belgians are German (9.6%, a difference of 0.030%), Immigrants from Zaire (9.6%, a difference of 0.080%), Yugoslavian (9.6%, a difference of 0.11%), Afghan (9.6%, a difference of 0.15%), and Australian (9.6%, a difference of 0.31%). Similarly, the demographic groups most similar to Ethiopians are Immigrants from Kenya (9.7%, a difference of 0.070%), Immigrants from Thailand (9.8%, a difference of 0.11%), Creek (9.7%, a difference of 0.21%), Immigrants from Serbia (9.8%, a difference of 0.22%), and Finnish (9.7%, a difference of 0.29%).
| Demographics | Rating | Rank | Unemployment Among Ages 20 to 24 years |
| Australians | 100.0 /100 | #33 | Exceptional 9.6% |
| Yugoslavians | 100.0 /100 | #34 | Exceptional 9.6% |
| Germans | 100.0 /100 | #35 | Exceptional 9.6% |
| Belgians | 100.0 /100 | #36 | Exceptional 9.6% |
| Immigrants | Zaire | 100.0 /100 | #37 | Exceptional 9.6% |
| Afghans | 99.9 /100 | #38 | Exceptional 9.6% |
| Dutch | 99.9 /100 | #39 | Exceptional 9.6% |
| Immigrants | Ethiopia | 99.9 /100 | #40 | Exceptional 9.6% |
| Swiss | 99.9 /100 | #41 | Exceptional 9.7% |
| Immigrants | Saudi Arabia | 99.9 /100 | #42 | Exceptional 9.7% |
| Menominee | 99.8 /100 | #43 | Exceptional 9.7% |
| Europeans | 99.8 /100 | #44 | Exceptional 9.7% |
| Croatians | 99.8 /100 | #45 | Exceptional 9.7% |
| Immigrants | Nicaragua | 99.8 /100 | #46 | Exceptional 9.7% |
| Immigrants | India | 99.8 /100 | #47 | Exceptional 9.7% |
| Finns | 99.8 /100 | #48 | Exceptional 9.7% |
| Creek | 99.8 /100 | #49 | Exceptional 9.7% |
| Immigrants | Kenya | 99.7 /100 | #50 | Exceptional 9.7% |
| Ethiopians | 99.7 /100 | #51 | Exceptional 9.8% |
| Immigrants | Thailand | 99.7 /100 | #52 | Exceptional 9.8% |
| Immigrants | Serbia | 99.6 /100 | #53 | Exceptional 9.8% |