Belgian vs Immigrants from Uruguay Disability
COMPARE
Belgian
Immigrants from Uruguay
Disability
Disability Comparison
Belgians
Immigrants from Uruguay
12.3%
DISABILITY
0.8/ 100
METRIC RATING
253rd/ 347
METRIC RANK
11.3%
DISABILITY
96.4/ 100
METRIC RATING
103rd/ 347
METRIC RANK
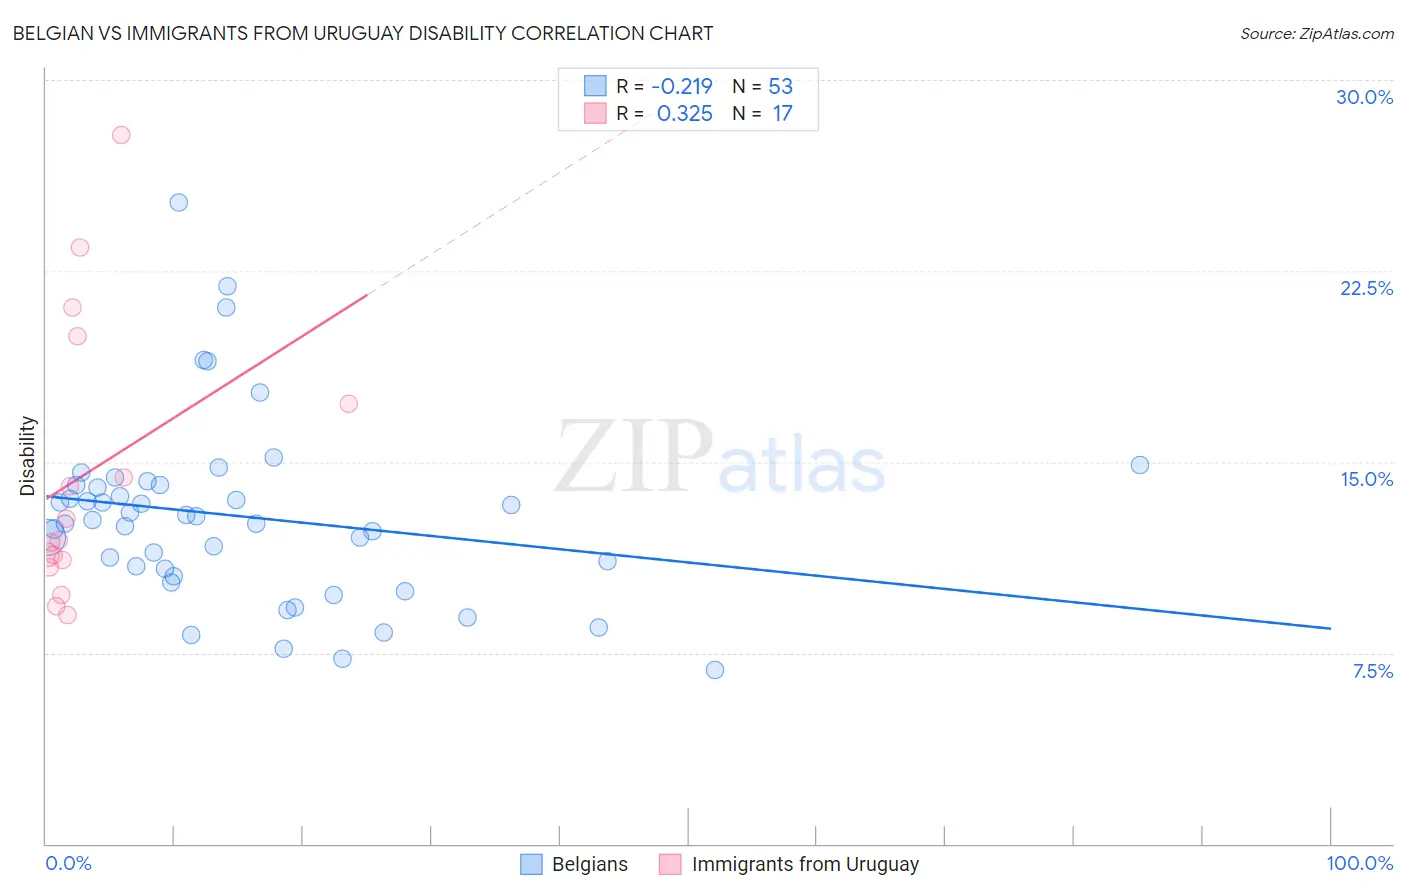
Belgian vs Immigrants from Uruguay Disability Correlation Chart
The statistical analysis conducted on geographies consisting of 355,995,745 people shows a weak negative correlation between the proportion of Belgians and percentage of population with a disability in the United States with a correlation coefficient (R) of -0.219 and weighted average of 12.3%. Similarly, the statistical analysis conducted on geographies consisting of 133,256,548 people shows a mild positive correlation between the proportion of Immigrants from Uruguay and percentage of population with a disability in the United States with a correlation coefficient (R) of 0.325 and weighted average of 11.3%, a difference of 9.3%.
Disability Correlation Summary
| Measurement | Belgian | Immigrants from Uruguay |
| Minimum | 6.8% | 9.0% |
| Maximum | 25.2% | 27.9% |
| Range | 18.3% | 18.8% |
| Mean | 12.9% | 14.5% |
| Median | 12.7% | 12.0% |
| Interquartile 25% (IQ1) | 10.7% | 11.0% |
| Interquartile 75% (IQ3) | 14.1% | 18.6% |
| Interquartile Range (IQR) | 3.4% | 7.6% |
| Standard Deviation (Sample) | 3.6% | 5.5% |
| Standard Deviation (Population) | 3.6% | 5.3% |
Similar Demographics by Disability
Demographics Similar to Belgians by Disability
In terms of disability, the demographic groups most similar to Belgians are German Russian (12.3%, a difference of 0.030%), Bermudan (12.3%, a difference of 0.31%), Slovene (12.4%, a difference of 0.35%), Immigrants from Dominica (12.4%, a difference of 0.42%), and Subsaharan African (12.3%, a difference of 0.50%).
| Demographics | Rating | Rank | Disability |
| Swiss | 1.5 /100 | #246 | Tragic 12.2% |
| Indonesians | 1.4 /100 | #247 | Tragic 12.2% |
| Guamanians/Chamorros | 1.4 /100 | #248 | Tragic 12.3% |
| Carpatho Rusyns | 1.4 /100 | #249 | Tragic 12.3% |
| Sub-Saharan Africans | 1.4 /100 | #250 | Tragic 12.3% |
| Europeans | 1.4 /100 | #251 | Tragic 12.3% |
| Bermudans | 1.1 /100 | #252 | Tragic 12.3% |
| Belgians | 0.8 /100 | #253 | Tragic 12.3% |
| German Russians | 0.8 /100 | #254 | Tragic 12.3% |
| Slovenes | 0.6 /100 | #255 | Tragic 12.4% |
| Immigrants | Dominica | 0.6 /100 | #256 | Tragic 12.4% |
| Immigrants | Laos | 0.5 /100 | #257 | Tragic 12.4% |
| Slavs | 0.5 /100 | #258 | Tragic 12.4% |
| Canadians | 0.4 /100 | #259 | Tragic 12.4% |
| Immigrants | Liberia | 0.4 /100 | #260 | Tragic 12.4% |
Demographics Similar to Immigrants from Uruguay by Disability
In terms of disability, the demographic groups most similar to Immigrants from Uruguay are Immigrants (11.3%, a difference of 0.010%), Immigrants from Kazakhstan (11.3%, a difference of 0.020%), Immigrants from Eastern Europe (11.3%, a difference of 0.040%), Nicaraguan (11.3%, a difference of 0.060%), and Immigrants from Eastern Africa (11.3%, a difference of 0.070%).
| Demographics | Rating | Rank | Disability |
| Immigrants | Zimbabwe | 97.7 /100 | #96 | Exceptional 11.2% |
| Bhutanese | 97.4 /100 | #97 | Exceptional 11.2% |
| Uruguayans | 97.4 /100 | #98 | Exceptional 11.2% |
| Immigrants | Czechoslovakia | 97.4 /100 | #99 | Exceptional 11.2% |
| Immigrants | Greece | 96.9 /100 | #100 | Exceptional 11.3% |
| Immigrants | Nicaragua | 96.8 /100 | #101 | Exceptional 11.3% |
| Immigrants | Eastern Africa | 96.7 /100 | #102 | Exceptional 11.3% |
| Immigrants | Uruguay | 96.4 /100 | #103 | Exceptional 11.3% |
| Immigrants | Immigrants | 96.4 /100 | #104 | Exceptional 11.3% |
| Immigrants | Kazakhstan | 96.4 /100 | #105 | Exceptional 11.3% |
| Immigrants | Eastern Europe | 96.3 /100 | #106 | Exceptional 11.3% |
| Nicaraguans | 96.2 /100 | #107 | Exceptional 11.3% |
| Immigrants | Nigeria | 96.0 /100 | #108 | Exceptional 11.3% |
| Immigrants | Uganda | 95.7 /100 | #109 | Exceptional 11.3% |
| Immigrants | Denmark | 95.6 /100 | #110 | Exceptional 11.3% |