Belgian vs Fijian Disability
COMPARE
Belgian
Fijian
Disability
Disability Comparison
Belgians
Fijians
12.3%
DISABILITY
0.8/ 100
METRIC RATING
253rd/ 347
METRIC RANK
12.8%
DISABILITY
0.0/ 100
METRIC RATING
279th/ 347
METRIC RANK
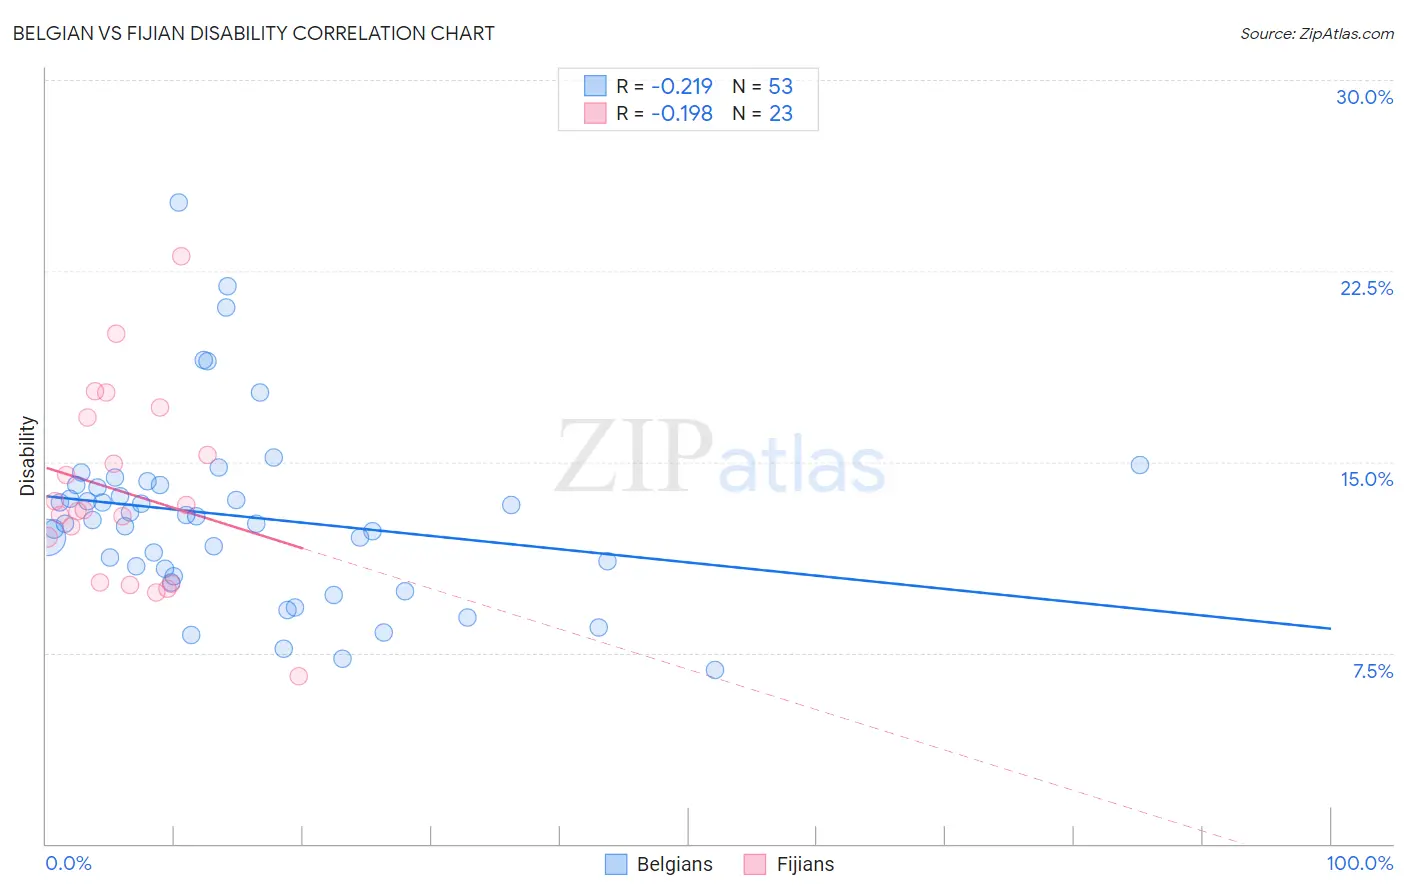
Belgian vs Fijian Disability Correlation Chart
The statistical analysis conducted on geographies consisting of 355,995,745 people shows a weak negative correlation between the proportion of Belgians and percentage of population with a disability in the United States with a correlation coefficient (R) of -0.219 and weighted average of 12.3%. Similarly, the statistical analysis conducted on geographies consisting of 55,947,896 people shows a poor negative correlation between the proportion of Fijians and percentage of population with a disability in the United States with a correlation coefficient (R) of -0.198 and weighted average of 12.8%, a difference of 4.2%.
Disability Correlation Summary
| Measurement | Belgian | Fijian |
| Minimum | 6.8% | 6.6% |
| Maximum | 25.2% | 23.1% |
| Range | 18.3% | 16.5% |
| Mean | 12.9% | 13.8% |
| Median | 12.7% | 13.1% |
| Interquartile 25% (IQ1) | 10.7% | 10.2% |
| Interquartile 75% (IQ3) | 14.1% | 16.8% |
| Interquartile Range (IQR) | 3.4% | 6.5% |
| Standard Deviation (Sample) | 3.6% | 3.7% |
| Standard Deviation (Population) | 3.6% | 3.7% |
Similar Demographics by Disability
Demographics Similar to Belgians by Disability
In terms of disability, the demographic groups most similar to Belgians are German Russian (12.3%, a difference of 0.030%), Bermudan (12.3%, a difference of 0.31%), Slovene (12.4%, a difference of 0.35%), Immigrants from Dominica (12.4%, a difference of 0.42%), and Subsaharan African (12.3%, a difference of 0.50%).
| Demographics | Rating | Rank | Disability |
| Swiss | 1.5 /100 | #246 | Tragic 12.2% |
| Indonesians | 1.4 /100 | #247 | Tragic 12.2% |
| Guamanians/Chamorros | 1.4 /100 | #248 | Tragic 12.3% |
| Carpatho Rusyns | 1.4 /100 | #249 | Tragic 12.3% |
| Sub-Saharan Africans | 1.4 /100 | #250 | Tragic 12.3% |
| Europeans | 1.4 /100 | #251 | Tragic 12.3% |
| Bermudans | 1.1 /100 | #252 | Tragic 12.3% |
| Belgians | 0.8 /100 | #253 | Tragic 12.3% |
| German Russians | 0.8 /100 | #254 | Tragic 12.3% |
| Slovenes | 0.6 /100 | #255 | Tragic 12.4% |
| Immigrants | Dominica | 0.6 /100 | #256 | Tragic 12.4% |
| Immigrants | Laos | 0.5 /100 | #257 | Tragic 12.4% |
| Slavs | 0.5 /100 | #258 | Tragic 12.4% |
| Canadians | 0.4 /100 | #259 | Tragic 12.4% |
| Immigrants | Liberia | 0.4 /100 | #260 | Tragic 12.4% |
Demographics Similar to Fijians by Disability
In terms of disability, the demographic groups most similar to Fijians are Spanish (12.8%, a difference of 0.050%), German (12.8%, a difference of 0.090%), Immigrants from Portugal (12.9%, a difference of 0.19%), Dutch (12.8%, a difference of 0.26%), and Hmong (12.8%, a difference of 0.31%).
| Demographics | Rating | Rank | Disability |
| Dominicans | 0.0 /100 | #272 | Tragic 12.7% |
| Finns | 0.0 /100 | #273 | Tragic 12.7% |
| Nepalese | 0.0 /100 | #274 | Tragic 12.8% |
| Sioux | 0.0 /100 | #275 | Tragic 12.8% |
| Hmong | 0.0 /100 | #276 | Tragic 12.8% |
| Dutch | 0.0 /100 | #277 | Tragic 12.8% |
| Germans | 0.0 /100 | #278 | Tragic 12.8% |
| Fijians | 0.0 /100 | #279 | Tragic 12.8% |
| Spanish | 0.0 /100 | #280 | Tragic 12.8% |
| Immigrants | Portugal | 0.0 /100 | #281 | Tragic 12.9% |
| Scottish | 0.0 /100 | #282 | Tragic 12.9% |
| Irish | 0.0 /100 | #283 | Tragic 12.9% |
| Welsh | 0.0 /100 | #284 | Tragic 12.9% |
| Crow | 0.0 /100 | #285 | Tragic 12.9% |
| English | 0.0 /100 | #286 | Tragic 13.0% |