Basque vs Immigrants from Japan Male Disability
COMPARE
Basque
Immigrants from Japan
Male Disability
Male Disability Comparison
Basques
Immigrants from Japan
12.1%
MALE DISABILITY
0.3/ 100
METRIC RATING
258th/ 347
METRIC RANK
10.4%
MALE DISABILITY
99.5/ 100
METRIC RATING
58th/ 347
METRIC RANK
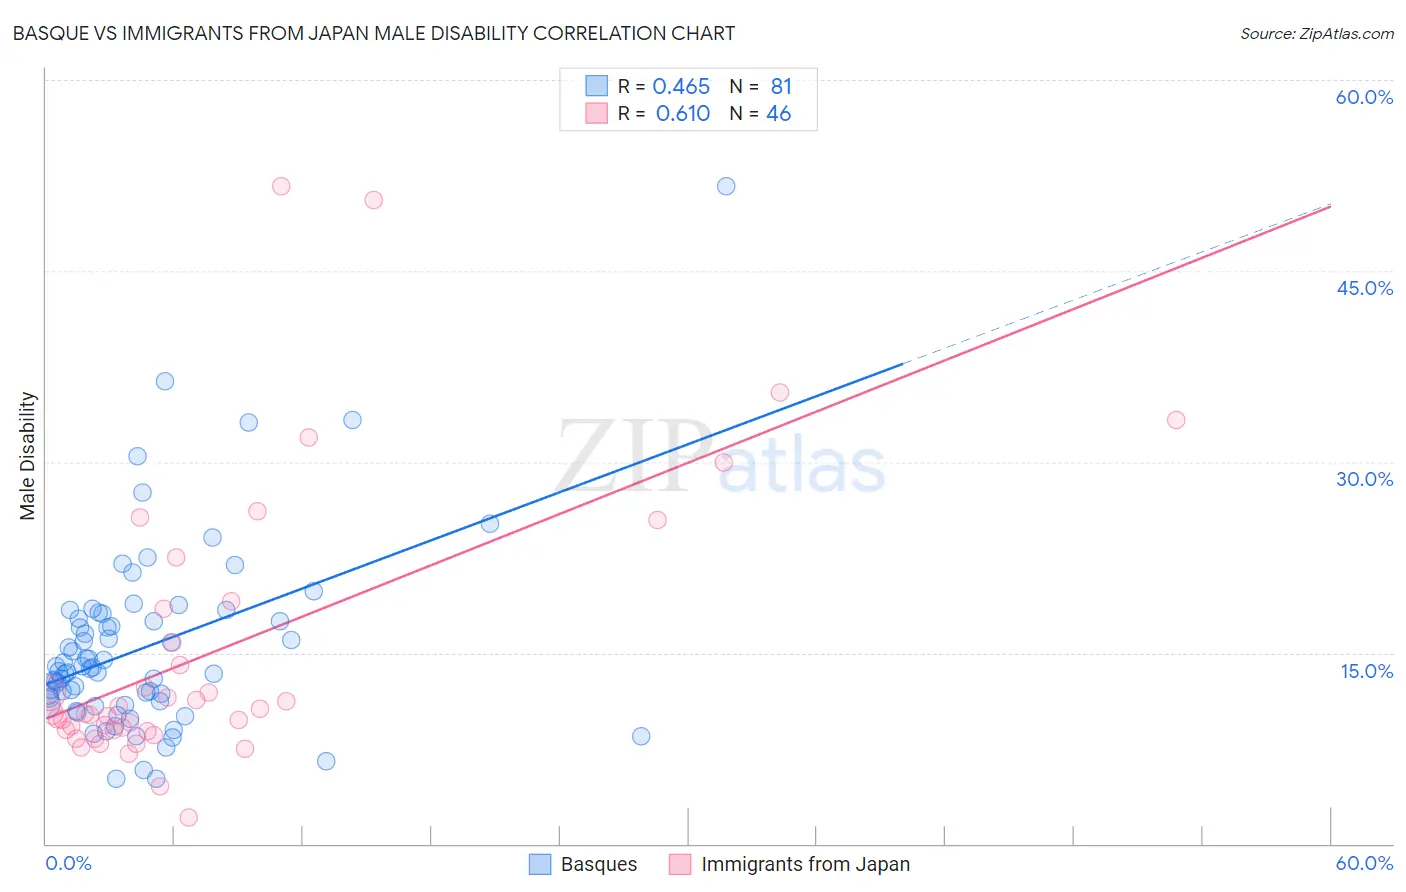
Basque vs Immigrants from Japan Male Disability Correlation Chart
The statistical analysis conducted on geographies consisting of 165,777,747 people shows a moderate positive correlation between the proportion of Basques and percentage of males with a disability in the United States with a correlation coefficient (R) of 0.465 and weighted average of 12.1%. Similarly, the statistical analysis conducted on geographies consisting of 340,135,143 people shows a significant positive correlation between the proportion of Immigrants from Japan and percentage of males with a disability in the United States with a correlation coefficient (R) of 0.610 and weighted average of 10.4%, a difference of 16.7%.
Male Disability Correlation Summary
| Measurement | Basque | Immigrants from Japan |
| Minimum | 5.1% | 2.1% |
| Maximum | 51.7% | 51.6% |
| Range | 46.6% | 49.5% |
| Mean | 15.4% | 15.1% |
| Median | 13.8% | 10.2% |
| Interquartile 25% (IQ1) | 11.1% | 8.9% |
| Interquartile 75% (IQ3) | 17.9% | 18.5% |
| Interquartile Range (IQR) | 6.7% | 9.6% |
| Standard Deviation (Sample) | 7.4% | 11.1% |
| Standard Deviation (Population) | 7.3% | 11.0% |
Similar Demographics by Male Disability
Demographics Similar to Basques by Male Disability
In terms of male disability, the demographic groups most similar to Basques are Belgian (12.1%, a difference of 0.040%), Swedish (12.1%, a difference of 0.12%), Swiss (12.1%, a difference of 0.19%), European (12.1%, a difference of 0.19%), and Chinese (12.1%, a difference of 0.44%).
| Demographics | Rating | Rank | Male Disability |
| German Russians | 0.5 /100 | #251 | Tragic 12.0% |
| Slovenes | 0.5 /100 | #252 | Tragic 12.0% |
| Guamanians/Chamorros | 0.5 /100 | #253 | Tragic 12.0% |
| British | 0.4 /100 | #254 | Tragic 12.1% |
| Chinese | 0.4 /100 | #255 | Tragic 12.1% |
| Swiss | 0.3 /100 | #256 | Tragic 12.1% |
| Europeans | 0.3 /100 | #257 | Tragic 12.1% |
| Basques | 0.3 /100 | #258 | Tragic 12.1% |
| Belgians | 0.3 /100 | #259 | Tragic 12.1% |
| Swedes | 0.3 /100 | #260 | Tragic 12.1% |
| Slavs | 0.2 /100 | #261 | Tragic 12.2% |
| Norwegians | 0.2 /100 | #262 | Tragic 12.2% |
| Canadians | 0.2 /100 | #263 | Tragic 12.2% |
| Nepalese | 0.2 /100 | #264 | Tragic 12.2% |
| Immigrants | Portugal | 0.1 /100 | #265 | Tragic 12.3% |
Demographics Similar to Immigrants from Japan by Male Disability
In terms of male disability, the demographic groups most similar to Immigrants from Japan are Immigrants from South America (10.4%, a difference of 0.070%), Tongan (10.4%, a difference of 0.10%), Immigrants from Eritrea (10.4%, a difference of 0.14%), Immigrants from Australia (10.4%, a difference of 0.14%), and Peruvian (10.4%, a difference of 0.15%).
| Demographics | Rating | Rank | Male Disability |
| Salvadorans | 99.6 /100 | #51 | Exceptional 10.4% |
| Immigrants | Saudi Arabia | 99.6 /100 | #52 | Exceptional 10.4% |
| Immigrants | Uzbekistan | 99.6 /100 | #53 | Exceptional 10.4% |
| Peruvians | 99.6 /100 | #54 | Exceptional 10.4% |
| Immigrants | Eritrea | 99.6 /100 | #55 | Exceptional 10.4% |
| Tongans | 99.6 /100 | #56 | Exceptional 10.4% |
| Immigrants | South America | 99.6 /100 | #57 | Exceptional 10.4% |
| Immigrants | Japan | 99.5 /100 | #58 | Exceptional 10.4% |
| Immigrants | Australia | 99.5 /100 | #59 | Exceptional 10.4% |
| Immigrants | Colombia | 99.5 /100 | #60 | Exceptional 10.4% |
| Immigrants | Northern Africa | 99.4 /100 | #61 | Exceptional 10.4% |
| Immigrants | Ecuador | 99.3 /100 | #62 | Exceptional 10.4% |
| Immigrants | Belarus | 99.3 /100 | #63 | Exceptional 10.4% |
| Jordanians | 99.3 /100 | #64 | Exceptional 10.5% |
| Immigrants | Grenada | 99.2 /100 | #65 | Exceptional 10.5% |