Basque vs Immigrants from Brazil Disability Age 5 to 17
COMPARE
Basque
Immigrants from Brazil
Disability Age 5 to 17
Disability Age 5 to 17 Comparison
Basques
Immigrants from Brazil
5.7%
DISABILITY AGE 5 TO 17
13.7/ 100
METRIC RATING
201st/ 347
METRIC RANK
5.8%
DISABILITY AGE 5 TO 17
3.2/ 100
METRIC RATING
236th/ 347
METRIC RANK
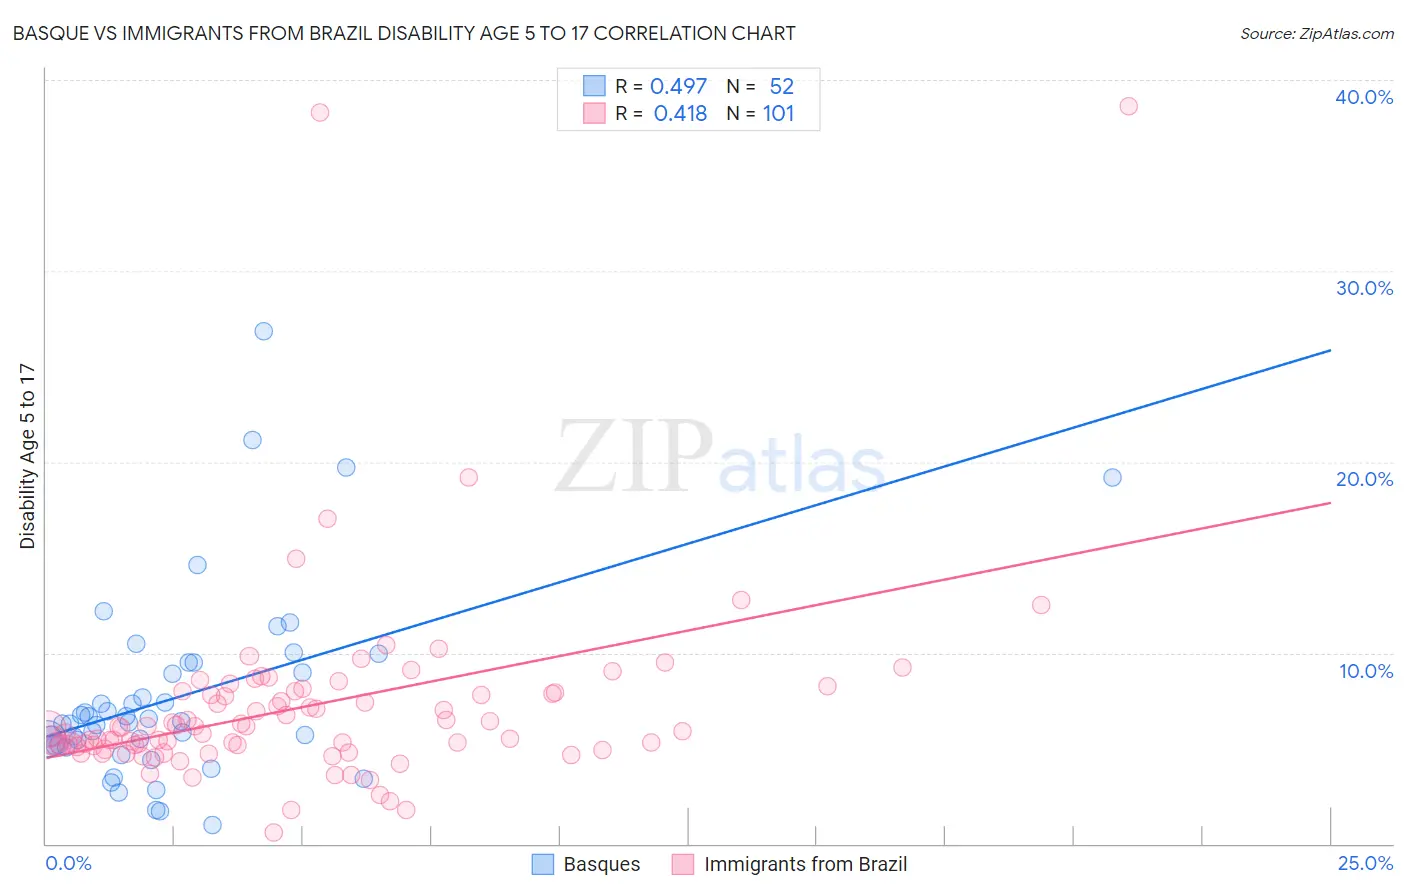
Basque vs Immigrants from Brazil Disability Age 5 to 17 Correlation Chart
The statistical analysis conducted on geographies consisting of 165,145,807 people shows a moderate positive correlation between the proportion of Basques and percentage of population with a disability between the ages 5 and 17 in the United States with a correlation coefficient (R) of 0.497 and weighted average of 5.7%. Similarly, the statistical analysis conducted on geographies consisting of 340,728,736 people shows a moderate positive correlation between the proportion of Immigrants from Brazil and percentage of population with a disability between the ages 5 and 17 in the United States with a correlation coefficient (R) of 0.418 and weighted average of 5.8%, a difference of 1.9%.
Disability Age 5 to 17 Correlation Summary
| Measurement | Basque | Immigrants from Brazil |
| Minimum | 0.97% | 0.57% |
| Maximum | 26.8% | 38.7% |
| Range | 25.9% | 38.1% |
| Mean | 7.7% | 7.2% |
| Median | 6.4% | 6.0% |
| Interquartile 25% (IQ1) | 5.2% | 5.1% |
| Interquartile 75% (IQ3) | 9.2% | 8.0% |
| Interquartile Range (IQR) | 4.0% | 2.8% |
| Standard Deviation (Sample) | 5.0% | 5.3% |
| Standard Deviation (Population) | 4.9% | 5.3% |
Similar Demographics by Disability Age 5 to 17
Demographics Similar to Basques by Disability Age 5 to 17
In terms of disability age 5 to 17, the demographic groups most similar to Basques are Austrian (5.7%, a difference of 0.050%), Icelander (5.7%, a difference of 0.090%), Spanish American Indian (5.7%, a difference of 0.090%), Northern European (5.7%, a difference of 0.15%), and Paiute (5.7%, a difference of 0.27%).
| Demographics | Rating | Rank | Disability Age 5 to 17 |
| Croatians | 23.6 /100 | #194 | Fair 5.7% |
| Immigrants | Nigeria | 23.4 /100 | #195 | Fair 5.7% |
| Inupiat | 23.3 /100 | #196 | Fair 5.7% |
| Immigrants | North America | 23.1 /100 | #197 | Fair 5.7% |
| Norwegians | 20.9 /100 | #198 | Fair 5.7% |
| Northern Europeans | 15.2 /100 | #199 | Poor 5.7% |
| Icelanders | 14.6 /100 | #200 | Poor 5.7% |
| Basques | 13.7 /100 | #201 | Poor 5.7% |
| Austrians | 13.2 /100 | #202 | Poor 5.7% |
| Spanish American Indians | 12.8 /100 | #203 | Poor 5.7% |
| Paiute | 11.2 /100 | #204 | Poor 5.7% |
| Trinidadians and Tobagonians | 10.8 /100 | #205 | Poor 5.7% |
| Immigrants | Africa | 10.8 /100 | #206 | Poor 5.7% |
| Moroccans | 10.4 /100 | #207 | Poor 5.7% |
| Kenyans | 10.0 /100 | #208 | Poor 5.8% |
Demographics Similar to Immigrants from Brazil by Disability Age 5 to 17
In terms of disability age 5 to 17, the demographic groups most similar to Immigrants from Brazil are Malaysian (5.8%, a difference of 0.060%), Immigrants from Kenya (5.8%, a difference of 0.070%), Immigrants from West Indies (5.8%, a difference of 0.11%), Sudanese (5.8%, a difference of 0.15%), and Immigrants from Laos (5.8%, a difference of 0.20%).
| Demographics | Rating | Rank | Disability Age 5 to 17 |
| Bangladeshis | 4.8 /100 | #229 | Tragic 5.8% |
| Ghanaians | 4.7 /100 | #230 | Tragic 5.8% |
| Europeans | 4.5 /100 | #231 | Tragic 5.8% |
| Immigrants | Laos | 3.8 /100 | #232 | Tragic 5.8% |
| Immigrants | West Indies | 3.5 /100 | #233 | Tragic 5.8% |
| Immigrants | Kenya | 3.4 /100 | #234 | Tragic 5.8% |
| Malaysians | 3.4 /100 | #235 | Tragic 5.8% |
| Immigrants | Brazil | 3.2 /100 | #236 | Tragic 5.8% |
| Sudanese | 2.9 /100 | #237 | Tragic 5.8% |
| Hungarians | 2.6 /100 | #238 | Tragic 5.8% |
| German Russians | 2.4 /100 | #239 | Tragic 5.9% |
| West Indians | 2.4 /100 | #240 | Tragic 5.9% |
| Immigrants | Caribbean | 2.1 /100 | #241 | Tragic 5.9% |
| Spaniards | 2.0 /100 | #242 | Tragic 5.9% |
| Indonesians | 2.0 /100 | #243 | Tragic 5.9% |