Basque vs Immigrants from Hungary Unemployment Among Ages 60 to 64 years
COMPARE
Basque
Immigrants from Hungary
Unemployment Among Ages 60 to 64 years
Unemployment Among Ages 60 to 64 years Comparison
Basques
Immigrants from Hungary
4.8%
UNEMPLOYMENT AMONG AGES 60 TO 64 YEARS
88.8/ 100
METRIC RATING
134th/ 347
METRIC RANK
4.9%
UNEMPLOYMENT AMONG AGES 60 TO 64 YEARS
50.2/ 100
METRIC RATING
173rd/ 347
METRIC RANK
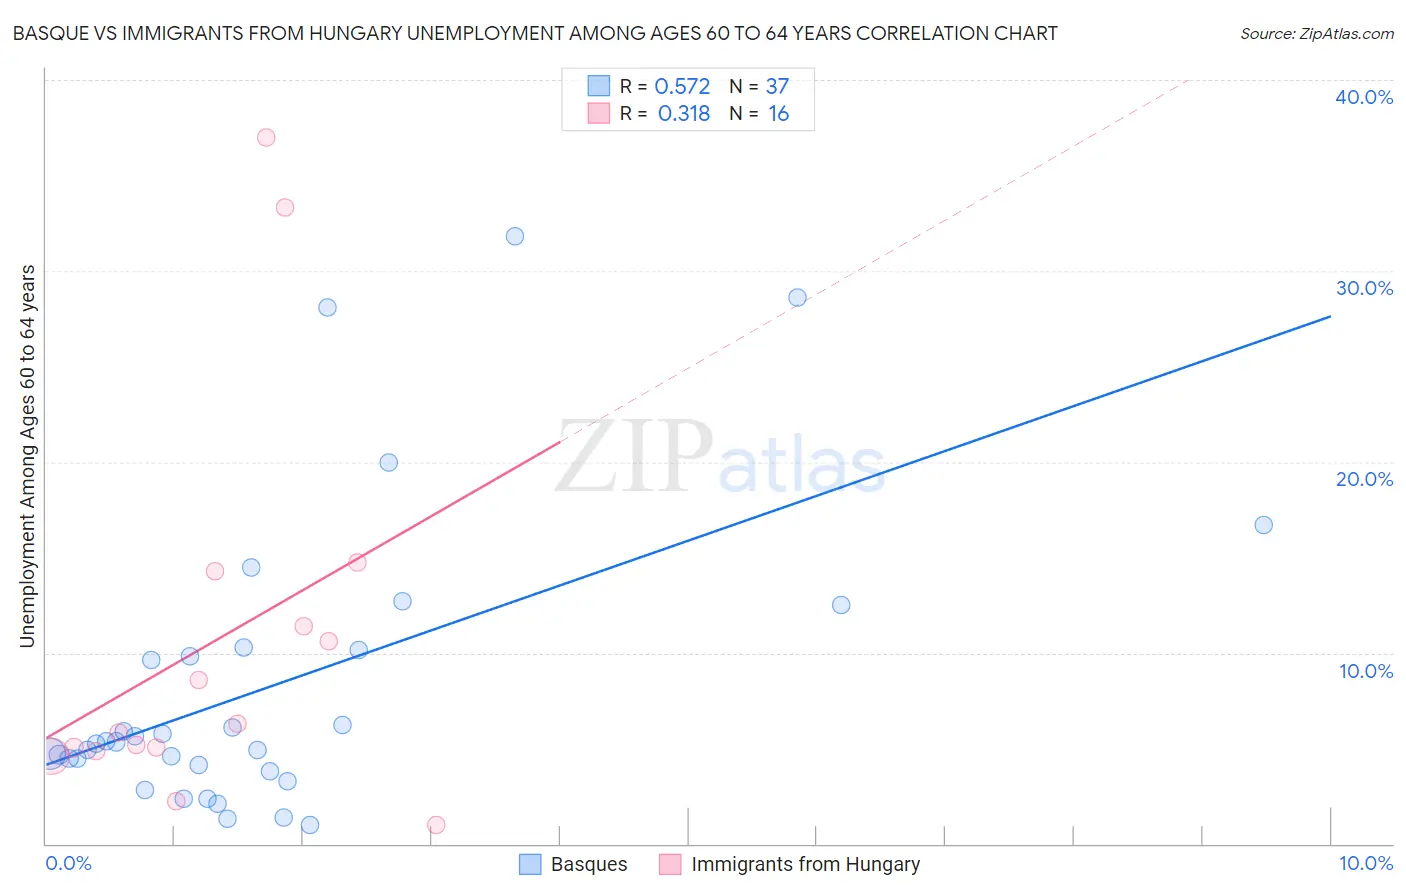
Basque vs Immigrants from Hungary Unemployment Among Ages 60 to 64 years Correlation Chart
The statistical analysis conducted on geographies consisting of 158,733,048 people shows a substantial positive correlation between the proportion of Basques and unemployment rate among population between the ages 60 and 64 in the United States with a correlation coefficient (R) of 0.572 and weighted average of 4.8%. Similarly, the statistical analysis conducted on geographies consisting of 186,606,017 people shows a mild positive correlation between the proportion of Immigrants from Hungary and unemployment rate among population between the ages 60 and 64 in the United States with a correlation coefficient (R) of 0.318 and weighted average of 4.9%, a difference of 1.8%.
Unemployment Among Ages 60 to 64 years Correlation Summary
| Measurement | Basque | Immigrants from Hungary |
| Minimum | 1.0% | 1.0% |
| Maximum | 31.8% | 37.0% |
| Range | 30.8% | 36.0% |
| Mean | 8.3% | 10.6% |
| Median | 5.3% | 6.1% |
| Interquartile 25% (IQ1) | 3.9% | 4.9% |
| Interquartile 75% (IQ3) | 10.2% | 12.9% |
| Interquartile Range (IQR) | 6.3% | 7.9% |
| Standard Deviation (Sample) | 7.7% | 10.4% |
| Standard Deviation (Population) | 7.6% | 10.0% |
Similar Demographics by Unemployment Among Ages 60 to 64 years
Demographics Similar to Basques by Unemployment Among Ages 60 to 64 years
In terms of unemployment among ages 60 to 64 years, the demographic groups most similar to Basques are Yaqui (4.8%, a difference of 0.060%), Immigrants from Lebanon (4.8%, a difference of 0.080%), Lithuanian (4.8%, a difference of 0.080%), Pennsylvania German (4.8%, a difference of 0.090%), and French Canadian (4.8%, a difference of 0.10%).
| Demographics | Rating | Rank | Unemployment Among Ages 60 to 64 years |
| Austrians | 91.9 /100 | #127 | Exceptional 4.8% |
| Choctaw | 90.3 /100 | #128 | Exceptional 4.8% |
| Immigrants | Serbia | 90.2 /100 | #129 | Exceptional 4.8% |
| Immigrants | Syria | 90.1 /100 | #130 | Exceptional 4.8% |
| Immigrants | Lebanon | 89.6 /100 | #131 | Excellent 4.8% |
| Lithuanians | 89.6 /100 | #132 | Excellent 4.8% |
| Yaqui | 89.5 /100 | #133 | Excellent 4.8% |
| Basques | 88.8 /100 | #134 | Excellent 4.8% |
| Pennsylvania Germans | 87.8 /100 | #135 | Excellent 4.8% |
| French Canadians | 87.6 /100 | #136 | Excellent 4.8% |
| Cambodians | 86.9 /100 | #137 | Excellent 4.8% |
| Immigrants | Lithuania | 86.7 /100 | #138 | Excellent 4.8% |
| Immigrants | Africa | 86.6 /100 | #139 | Excellent 4.8% |
| Pima | 85.8 /100 | #140 | Excellent 4.8% |
| Panamanians | 85.5 /100 | #141 | Excellent 4.8% |
Demographics Similar to Immigrants from Hungary by Unemployment Among Ages 60 to 64 years
In terms of unemployment among ages 60 to 64 years, the demographic groups most similar to Immigrants from Hungary are Immigrants from Western Europe (4.9%, a difference of 0.010%), Immigrants from Turkey (4.9%, a difference of 0.090%), Samoan (4.9%, a difference of 0.12%), Immigrants from Latvia (4.9%, a difference of 0.12%), and Bermudan (4.9%, a difference of 0.13%).
| Demographics | Rating | Rank | Unemployment Among Ages 60 to 64 years |
| Palestinians | 60.5 /100 | #166 | Good 4.8% |
| Immigrants | Northern Europe | 59.1 /100 | #167 | Average 4.8% |
| Immigrants | Southern Europe | 56.7 /100 | #168 | Average 4.8% |
| Immigrants | France | 55.5 /100 | #169 | Average 4.8% |
| Immigrants | Korea | 54.2 /100 | #170 | Average 4.8% |
| Samoans | 53.6 /100 | #171 | Average 4.9% |
| Immigrants | Turkey | 52.8 /100 | #172 | Average 4.9% |
| Immigrants | Hungary | 50.2 /100 | #173 | Average 4.9% |
| Immigrants | Western Europe | 50.0 /100 | #174 | Average 4.9% |
| Immigrants | Latvia | 46.9 /100 | #175 | Average 4.9% |
| Bermudans | 46.5 /100 | #176 | Average 4.9% |
| Immigrants | Malaysia | 44.7 /100 | #177 | Average 4.9% |
| Immigrants | Nonimmigrants | 44.5 /100 | #178 | Average 4.9% |
| Immigrants | Sweden | 44.3 /100 | #179 | Average 4.9% |
| Asians | 40.8 /100 | #180 | Average 4.9% |