Barbadian vs Immigrants from Middle Africa Disability Age Under 5
COMPARE
Barbadian
Immigrants from Middle Africa
Disability Age Under 5
Disability Age Under 5 Comparison
Barbadians
Immigrants from Middle Africa
1.0%
DISABILITY AGE UNDER 5
99.9/ 100
METRIC RATING
35th/ 347
METRIC RANK
1.2%
DISABILITY AGE UNDER 5
79.3/ 100
METRIC RATING
144th/ 347
METRIC RANK
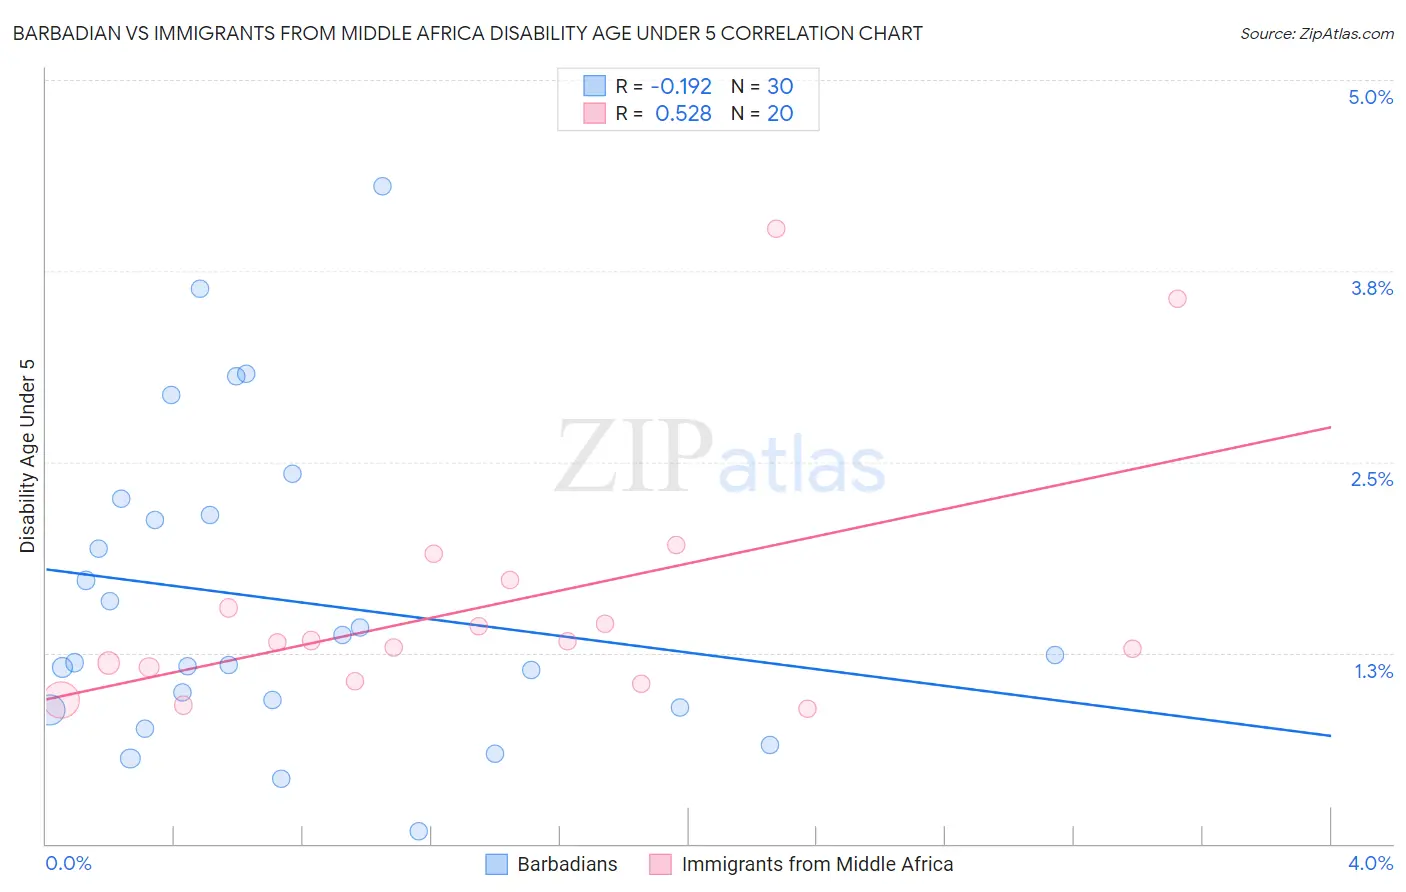
Barbadian vs Immigrants from Middle Africa Disability Age Under 5 Correlation Chart
The statistical analysis conducted on geographies consisting of 100,337,309 people shows a poor negative correlation between the proportion of Barbadians and percentage of population with a disability under the age of 5 in the United States with a correlation coefficient (R) of -0.192 and weighted average of 1.0%. Similarly, the statistical analysis conducted on geographies consisting of 135,378,258 people shows a substantial positive correlation between the proportion of Immigrants from Middle Africa and percentage of population with a disability under the age of 5 in the United States with a correlation coefficient (R) of 0.528 and weighted average of 1.2%, a difference of 16.0%.
Disability Age Under 5 Correlation Summary
| Measurement | Barbadian | Immigrants from Middle Africa |
| Minimum | 0.086% | 0.88% |
| Maximum | 4.3% | 4.0% |
| Range | 4.2% | 3.1% |
| Mean | 1.6% | 1.6% |
| Median | 1.2% | 1.3% |
| Interquartile 25% (IQ1) | 0.89% | 1.1% |
| Interquartile 75% (IQ3) | 2.2% | 1.6% |
| Interquartile Range (IQR) | 1.3% | 0.53% |
| Standard Deviation (Sample) | 1.0% | 0.82% |
| Standard Deviation (Population) | 1.00% | 0.80% |
Similar Demographics by Disability Age Under 5
Demographics Similar to Barbadians by Disability Age Under 5
In terms of disability age under 5, the demographic groups most similar to Barbadians are Immigrants from Ukraine (1.0%, a difference of 0.24%), Bolivian (1.0%, a difference of 0.36%), Iranian (1.0%, a difference of 0.53%), Armenian (1.0%, a difference of 0.58%), and Immigrants from Nepal (1.0%, a difference of 0.71%).
| Demographics | Rating | Rank | Disability Age Under 5 |
| Immigrants | Eastern Asia | 100.0 /100 | #28 | Exceptional 1.0% |
| Immigrants | Belarus | 100.0 /100 | #29 | Exceptional 1.0% |
| Immigrants | South Central Asia | 99.9 /100 | #30 | Exceptional 1.0% |
| Armenians | 99.9 /100 | #31 | Exceptional 1.0% |
| Iranians | 99.9 /100 | #32 | Exceptional 1.0% |
| Bolivians | 99.9 /100 | #33 | Exceptional 1.0% |
| Immigrants | Ukraine | 99.9 /100 | #34 | Exceptional 1.0% |
| Barbadians | 99.9 /100 | #35 | Exceptional 1.0% |
| Immigrants | Nepal | 99.9 /100 | #36 | Exceptional 1.0% |
| Immigrants | India | 99.9 /100 | #37 | Exceptional 1.0% |
| Immigrants | Guyana | 99.9 /100 | #38 | Exceptional 1.0% |
| Filipinos | 99.9 /100 | #39 | Exceptional 1.1% |
| Immigrants | Albania | 99.9 /100 | #40 | Exceptional 1.1% |
| Thais | 99.8 /100 | #41 | Exceptional 1.1% |
| Immigrants | Bulgaria | 99.8 /100 | #42 | Exceptional 1.1% |
Demographics Similar to Immigrants from Middle Africa by Disability Age Under 5
In terms of disability age under 5, the demographic groups most similar to Immigrants from Middle Africa are Alsatian (1.2%, a difference of 0.0%), Immigrants from Colombia (1.2%, a difference of 0.010%), Immigrants from Honduras (1.2%, a difference of 0.16%), Immigrants from Zimbabwe (1.2%, a difference of 0.18%), and Somali (1.2%, a difference of 0.22%).
| Demographics | Rating | Rank | Disability Age Under 5 |
| Immigrants | Eastern Africa | 83.1 /100 | #137 | Excellent 1.2% |
| Immigrants | Czechoslovakia | 82.8 /100 | #138 | Excellent 1.2% |
| New Zealanders | 81.4 /100 | #139 | Excellent 1.2% |
| Somalis | 80.8 /100 | #140 | Excellent 1.2% |
| Immigrants | Honduras | 80.4 /100 | #141 | Excellent 1.2% |
| Immigrants | Colombia | 79.3 /100 | #142 | Good 1.2% |
| Alsatians | 79.3 /100 | #143 | Good 1.2% |
| Immigrants | Middle Africa | 79.3 /100 | #144 | Good 1.2% |
| Immigrants | Zimbabwe | 77.9 /100 | #145 | Good 1.2% |
| Samoans | 77.7 /100 | #146 | Good 1.2% |
| Icelanders | 76.3 /100 | #147 | Good 1.2% |
| Ghanaians | 76.3 /100 | #148 | Good 1.2% |
| Kenyans | 75.9 /100 | #149 | Good 1.2% |
| South Americans | 75.6 /100 | #150 | Good 1.2% |
| Yaqui | 74.8 /100 | #151 | Good 1.2% |