Barbadian vs Immigrants from Iraq Disability Age Under 5
COMPARE
Barbadian
Immigrants from Iraq
Disability Age Under 5
Disability Age Under 5 Comparison
Barbadians
Immigrants from Iraq
1.0%
DISABILITY AGE UNDER 5
99.9/ 100
METRIC RATING
35th/ 347
METRIC RANK
1.1%
DISABILITY AGE UNDER 5
96.5/ 100
METRIC RATING
97th/ 347
METRIC RANK
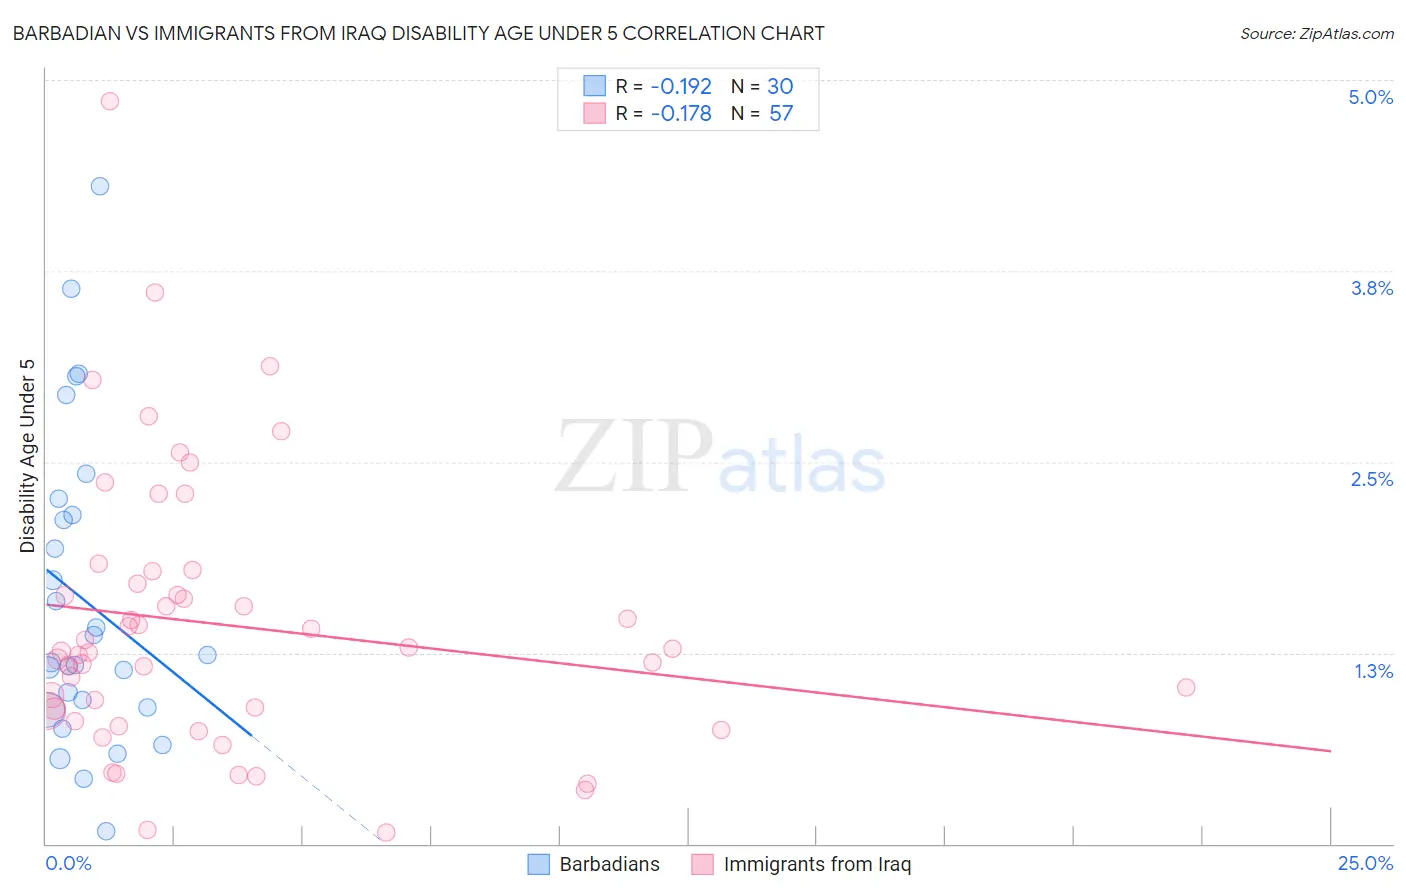
Barbadian vs Immigrants from Iraq Disability Age Under 5 Correlation Chart
The statistical analysis conducted on geographies consisting of 100,337,309 people shows a poor negative correlation between the proportion of Barbadians and percentage of population with a disability under the age of 5 in the United States with a correlation coefficient (R) of -0.192 and weighted average of 1.0%. Similarly, the statistical analysis conducted on geographies consisting of 131,193,910 people shows a poor negative correlation between the proportion of Immigrants from Iraq and percentage of population with a disability under the age of 5 in the United States with a correlation coefficient (R) of -0.178 and weighted average of 1.1%, a difference of 10.6%.
Disability Age Under 5 Correlation Summary
| Measurement | Barbadian | Immigrants from Iraq |
| Minimum | 0.086% | 0.070% |
| Maximum | 4.3% | 4.9% |
| Range | 4.2% | 4.8% |
| Mean | 1.6% | 1.4% |
| Median | 1.2% | 1.3% |
| Interquartile 25% (IQ1) | 0.89% | 0.84% |
| Interquartile 75% (IQ3) | 2.2% | 1.7% |
| Interquartile Range (IQR) | 1.3% | 0.91% |
| Standard Deviation (Sample) | 1.0% | 0.90% |
| Standard Deviation (Population) | 1.00% | 0.89% |
Similar Demographics by Disability Age Under 5
Demographics Similar to Barbadians by Disability Age Under 5
In terms of disability age under 5, the demographic groups most similar to Barbadians are Immigrants from Ukraine (1.0%, a difference of 0.24%), Bolivian (1.0%, a difference of 0.36%), Iranian (1.0%, a difference of 0.53%), Armenian (1.0%, a difference of 0.58%), and Immigrants from Nepal (1.0%, a difference of 0.71%).
| Demographics | Rating | Rank | Disability Age Under 5 |
| Immigrants | Eastern Asia | 100.0 /100 | #28 | Exceptional 1.0% |
| Immigrants | Belarus | 100.0 /100 | #29 | Exceptional 1.0% |
| Immigrants | South Central Asia | 99.9 /100 | #30 | Exceptional 1.0% |
| Armenians | 99.9 /100 | #31 | Exceptional 1.0% |
| Iranians | 99.9 /100 | #32 | Exceptional 1.0% |
| Bolivians | 99.9 /100 | #33 | Exceptional 1.0% |
| Immigrants | Ukraine | 99.9 /100 | #34 | Exceptional 1.0% |
| Barbadians | 99.9 /100 | #35 | Exceptional 1.0% |
| Immigrants | Nepal | 99.9 /100 | #36 | Exceptional 1.0% |
| Immigrants | India | 99.9 /100 | #37 | Exceptional 1.0% |
| Immigrants | Guyana | 99.9 /100 | #38 | Exceptional 1.0% |
| Filipinos | 99.9 /100 | #39 | Exceptional 1.1% |
| Immigrants | Albania | 99.9 /100 | #40 | Exceptional 1.1% |
| Thais | 99.8 /100 | #41 | Exceptional 1.1% |
| Immigrants | Bulgaria | 99.8 /100 | #42 | Exceptional 1.1% |
Demographics Similar to Immigrants from Iraq by Disability Age Under 5
In terms of disability age under 5, the demographic groups most similar to Immigrants from Iraq are Immigrants from South Eastern Asia (1.1%, a difference of 0.010%), Mongolian (1.1%, a difference of 0.10%), Dominican (1.1%, a difference of 0.14%), Nicaraguan (1.1%, a difference of 0.17%), and Immigrants from Moldova (1.1%, a difference of 0.20%).
| Demographics | Rating | Rank | Disability Age Under 5 |
| Chinese | 97.2 /100 | #90 | Exceptional 1.1% |
| Albanians | 97.2 /100 | #91 | Exceptional 1.1% |
| Immigrants | Cuba | 97.0 /100 | #92 | Exceptional 1.1% |
| Spanish Americans | 96.9 /100 | #93 | Exceptional 1.1% |
| Sri Lankans | 96.8 /100 | #94 | Exceptional 1.1% |
| Immigrants | Moldova | 96.8 /100 | #95 | Exceptional 1.1% |
| Mongolians | 96.6 /100 | #96 | Exceptional 1.1% |
| Immigrants | Iraq | 96.5 /100 | #97 | Exceptional 1.1% |
| Immigrants | South Eastern Asia | 96.5 /100 | #98 | Exceptional 1.1% |
| Dominicans | 96.3 /100 | #99 | Exceptional 1.1% |
| Nicaraguans | 96.3 /100 | #100 | Exceptional 1.1% |
| Immigrants | Uganda | 96.1 /100 | #101 | Exceptional 1.1% |
| Immigrants | Morocco | 96.0 /100 | #102 | Exceptional 1.2% |
| Immigrants | Nicaragua | 96.0 /100 | #103 | Exceptional 1.2% |
| Indonesians | 95.9 /100 | #104 | Exceptional 1.2% |