Barbadian vs Peruvian Disability Age Under 5
COMPARE
Barbadian
Peruvian
Disability Age Under 5
Disability Age Under 5 Comparison
Barbadians
Peruvians
1.0%
DISABILITY AGE UNDER 5
99.9/ 100
METRIC RATING
35th/ 347
METRIC RANK
1.3%
DISABILITY AGE UNDER 5
37.6/ 100
METRIC RATING
189th/ 347
METRIC RANK
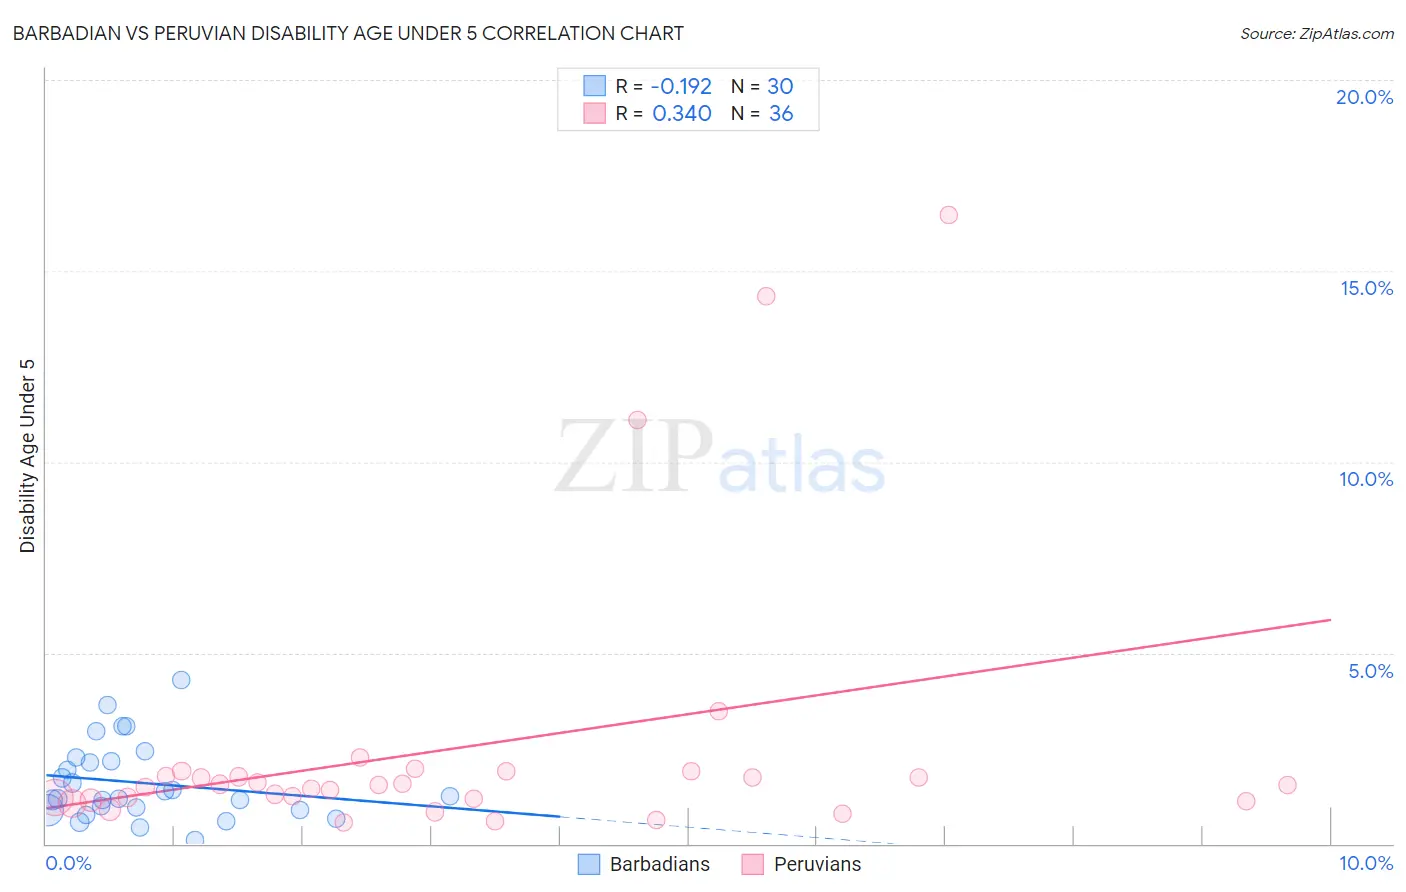
Barbadian vs Peruvian Disability Age Under 5 Correlation Chart
The statistical analysis conducted on geographies consisting of 100,337,309 people shows a poor negative correlation between the proportion of Barbadians and percentage of population with a disability under the age of 5 in the United States with a correlation coefficient (R) of -0.192 and weighted average of 1.0%. Similarly, the statistical analysis conducted on geographies consisting of 205,658,783 people shows a mild positive correlation between the proportion of Peruvians and percentage of population with a disability under the age of 5 in the United States with a correlation coefficient (R) of 0.340 and weighted average of 1.3%, a difference of 21.0%.
Disability Age Under 5 Correlation Summary
| Measurement | Barbadian | Peruvian |
| Minimum | 0.086% | 0.55% |
| Maximum | 4.3% | 16.5% |
| Range | 4.2% | 15.9% |
| Mean | 1.6% | 2.5% |
| Median | 1.2% | 1.6% |
| Interquartile 25% (IQ1) | 0.89% | 1.2% |
| Interquartile 75% (IQ3) | 2.2% | 1.8% |
| Interquartile Range (IQR) | 1.3% | 0.66% |
| Standard Deviation (Sample) | 1.0% | 3.6% |
| Standard Deviation (Population) | 1.00% | 3.6% |
Similar Demographics by Disability Age Under 5
Demographics Similar to Barbadians by Disability Age Under 5
In terms of disability age under 5, the demographic groups most similar to Barbadians are Immigrants from Ukraine (1.0%, a difference of 0.24%), Bolivian (1.0%, a difference of 0.36%), Iranian (1.0%, a difference of 0.53%), Armenian (1.0%, a difference of 0.58%), and Immigrants from Nepal (1.0%, a difference of 0.71%).
| Demographics | Rating | Rank | Disability Age Under 5 |
| Immigrants | Eastern Asia | 100.0 /100 | #28 | Exceptional 1.0% |
| Immigrants | Belarus | 100.0 /100 | #29 | Exceptional 1.0% |
| Immigrants | South Central Asia | 99.9 /100 | #30 | Exceptional 1.0% |
| Armenians | 99.9 /100 | #31 | Exceptional 1.0% |
| Iranians | 99.9 /100 | #32 | Exceptional 1.0% |
| Bolivians | 99.9 /100 | #33 | Exceptional 1.0% |
| Immigrants | Ukraine | 99.9 /100 | #34 | Exceptional 1.0% |
| Barbadians | 99.9 /100 | #35 | Exceptional 1.0% |
| Immigrants | Nepal | 99.9 /100 | #36 | Exceptional 1.0% |
| Immigrants | India | 99.9 /100 | #37 | Exceptional 1.0% |
| Immigrants | Guyana | 99.9 /100 | #38 | Exceptional 1.0% |
| Filipinos | 99.9 /100 | #39 | Exceptional 1.1% |
| Immigrants | Albania | 99.9 /100 | #40 | Exceptional 1.1% |
| Thais | 99.8 /100 | #41 | Exceptional 1.1% |
| Immigrants | Bulgaria | 99.8 /100 | #42 | Exceptional 1.1% |
Demographics Similar to Peruvians by Disability Age Under 5
In terms of disability age under 5, the demographic groups most similar to Peruvians are Immigrants from Laos (1.3%, a difference of 0.090%), Mexican American Indian (1.3%, a difference of 0.10%), Immigrants from Bosnia and Herzegovina (1.3%, a difference of 0.10%), Immigrants from Sierra Leone (1.3%, a difference of 0.11%), and Haitian (1.3%, a difference of 0.22%).
| Demographics | Rating | Rank | Disability Age Under 5 |
| Immigrants | Saudi Arabia | 43.3 /100 | #183 | Average 1.2% |
| Palestinians | 43.0 /100 | #184 | Average 1.2% |
| Immigrants | Western Africa | 42.5 /100 | #185 | Average 1.2% |
| Cubans | 42.5 /100 | #186 | Average 1.2% |
| Immigrants | Haiti | 40.2 /100 | #187 | Average 1.3% |
| Haitians | 39.9 /100 | #188 | Fair 1.3% |
| Peruvians | 37.6 /100 | #189 | Fair 1.3% |
| Immigrants | Laos | 36.6 /100 | #190 | Fair 1.3% |
| Mexican American Indians | 36.6 /100 | #191 | Fair 1.3% |
| Immigrants | Bosnia and Herzegovina | 36.5 /100 | #192 | Fair 1.3% |
| Immigrants | Sierra Leone | 36.5 /100 | #193 | Fair 1.3% |
| Immigrants | North Macedonia | 34.7 /100 | #194 | Fair 1.3% |
| U.S. Virgin Islanders | 34.4 /100 | #195 | Fair 1.3% |
| Immigrants | Belgium | 31.4 /100 | #196 | Fair 1.3% |