Barbadian vs Immigrants from Middle Africa No Vehicles in Household
COMPARE
Barbadian
Immigrants from Middle Africa
No Vehicles in Household
No Vehicles in Household Comparison
Barbadians
Immigrants from Middle Africa
26.1%
NO VEHICLES IN HOUSEHOLD
0.0/ 100
METRIC RATING
335th/ 347
METRIC RANK
10.2%
NO VEHICLES IN HOUSEHOLD
65.7/ 100
METRIC RATING
160th/ 347
METRIC RANK
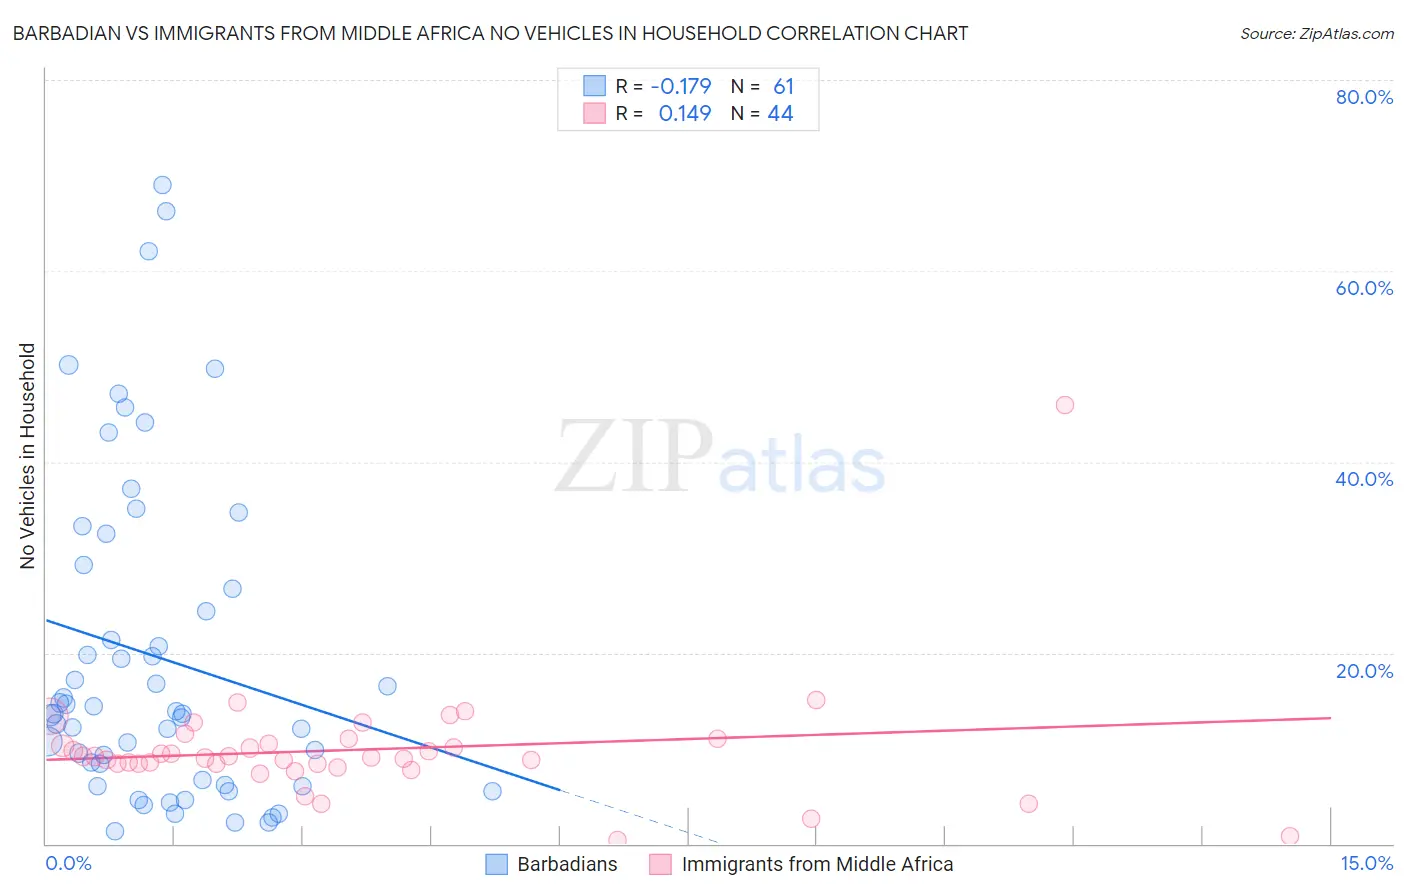
Barbadian vs Immigrants from Middle Africa No Vehicles in Household Correlation Chart
The statistical analysis conducted on geographies consisting of 141,232,978 people shows a poor negative correlation between the proportion of Barbadians and percentage of households with no vehicle available in the United States with a correlation coefficient (R) of -0.179 and weighted average of 26.1%. Similarly, the statistical analysis conducted on geographies consisting of 202,497,217 people shows a poor positive correlation between the proportion of Immigrants from Middle Africa and percentage of households with no vehicle available in the United States with a correlation coefficient (R) of 0.149 and weighted average of 10.2%, a difference of 156.4%.
No Vehicles in Household Correlation Summary
| Measurement | Barbadian | Immigrants from Middle Africa |
| Minimum | 1.3% | 0.36% |
| Maximum | 69.0% | 46.0% |
| Range | 67.7% | 45.6% |
| Mean | 19.5% | 9.8% |
| Median | 13.6% | 9.1% |
| Interquartile 25% (IQ1) | 6.4% | 8.3% |
| Interquartile 75% (IQ3) | 28.0% | 10.7% |
| Interquartile Range (IQR) | 21.6% | 2.4% |
| Standard Deviation (Sample) | 16.9% | 6.4% |
| Standard Deviation (Population) | 16.8% | 6.3% |
Similar Demographics by No Vehicles in Household
Demographics Similar to Barbadians by No Vehicles in Household
In terms of no vehicles in household, the demographic groups most similar to Barbadians are Vietnamese (26.2%, a difference of 0.56%), Immigrants from Bangladesh (25.8%, a difference of 1.3%), Immigrants from Uzbekistan (26.7%, a difference of 2.2%), Immigrants from Trinidad and Tobago (24.6%, a difference of 5.9%), and Immigrants from Ecuador (23.8%, a difference of 9.5%).
| Demographics | Rating | Rank | No Vehicles in Household |
| Immigrants | Dominica | 0.0 /100 | #328 | Tragic 22.2% |
| Ecuadorians | 0.0 /100 | #329 | Tragic 22.8% |
| West Indians | 0.0 /100 | #330 | Tragic 23.7% |
| Trinidadians and Tobagonians | 0.0 /100 | #331 | Tragic 23.7% |
| Immigrants | Ecuador | 0.0 /100 | #332 | Tragic 23.8% |
| Immigrants | Trinidad and Tobago | 0.0 /100 | #333 | Tragic 24.6% |
| Immigrants | Bangladesh | 0.0 /100 | #334 | Tragic 25.8% |
| Barbadians | 0.0 /100 | #335 | Tragic 26.1% |
| Vietnamese | 0.0 /100 | #336 | Tragic 26.2% |
| Immigrants | Uzbekistan | 0.0 /100 | #337 | Tragic 26.7% |
| Guyanese | 0.0 /100 | #338 | Tragic 29.3% |
| Dominicans | 0.0 /100 | #339 | Tragic 29.4% |
| Immigrants | Barbados | 0.0 /100 | #340 | Tragic 29.5% |
| Immigrants | Guyana | 0.0 /100 | #341 | Tragic 29.5% |
| British West Indians | 0.0 /100 | #342 | Tragic 29.7% |
Demographics Similar to Immigrants from Middle Africa by No Vehicles in Household
In terms of no vehicles in household, the demographic groups most similar to Immigrants from Middle Africa are New Zealander (10.2%, a difference of 0.10%), Immigrants from Austria (10.2%, a difference of 0.20%), Immigrants from Cambodia (10.2%, a difference of 0.31%), Immigrants from Indonesia (10.1%, a difference of 0.58%), and South African (10.2%, a difference of 0.68%).
| Demographics | Rating | Rank | No Vehicles in Household |
| Tlingit-Haida | 72.5 /100 | #153 | Good 10.1% |
| Sioux | 72.4 /100 | #154 | Good 10.1% |
| Salvadorans | 72.4 /100 | #155 | Good 10.1% |
| Immigrants | Micronesia | 70.9 /100 | #156 | Good 10.1% |
| Australians | 70.6 /100 | #157 | Good 10.1% |
| Spanish American Indians | 70.2 /100 | #158 | Good 10.1% |
| Immigrants | Indonesia | 69.3 /100 | #159 | Good 10.1% |
| Immigrants | Middle Africa | 65.7 /100 | #160 | Good 10.2% |
| New Zealanders | 65.1 /100 | #161 | Good 10.2% |
| Immigrants | Austria | 64.4 /100 | #162 | Good 10.2% |
| Immigrants | Cambodia | 63.7 /100 | #163 | Good 10.2% |
| South Africans | 61.1 /100 | #164 | Good 10.2% |
| Comanche | 60.8 /100 | #165 | Good 10.2% |
| Immigrants | Costa Rica | 60.5 /100 | #166 | Good 10.3% |
| Immigrants | Saudi Arabia | 58.8 /100 | #167 | Average 10.3% |