Barbadian vs Central American Indian Hearing Disability
COMPARE
Barbadian
Central American Indian
Hearing Disability
Hearing Disability Comparison
Barbadians
Central American Indians
2.5%
HEARING DISABILITY
99.9/ 100
METRIC RATING
15th/ 347
METRIC RANK
3.3%
HEARING DISABILITY
2.3/ 100
METRIC RATING
234th/ 347
METRIC RANK
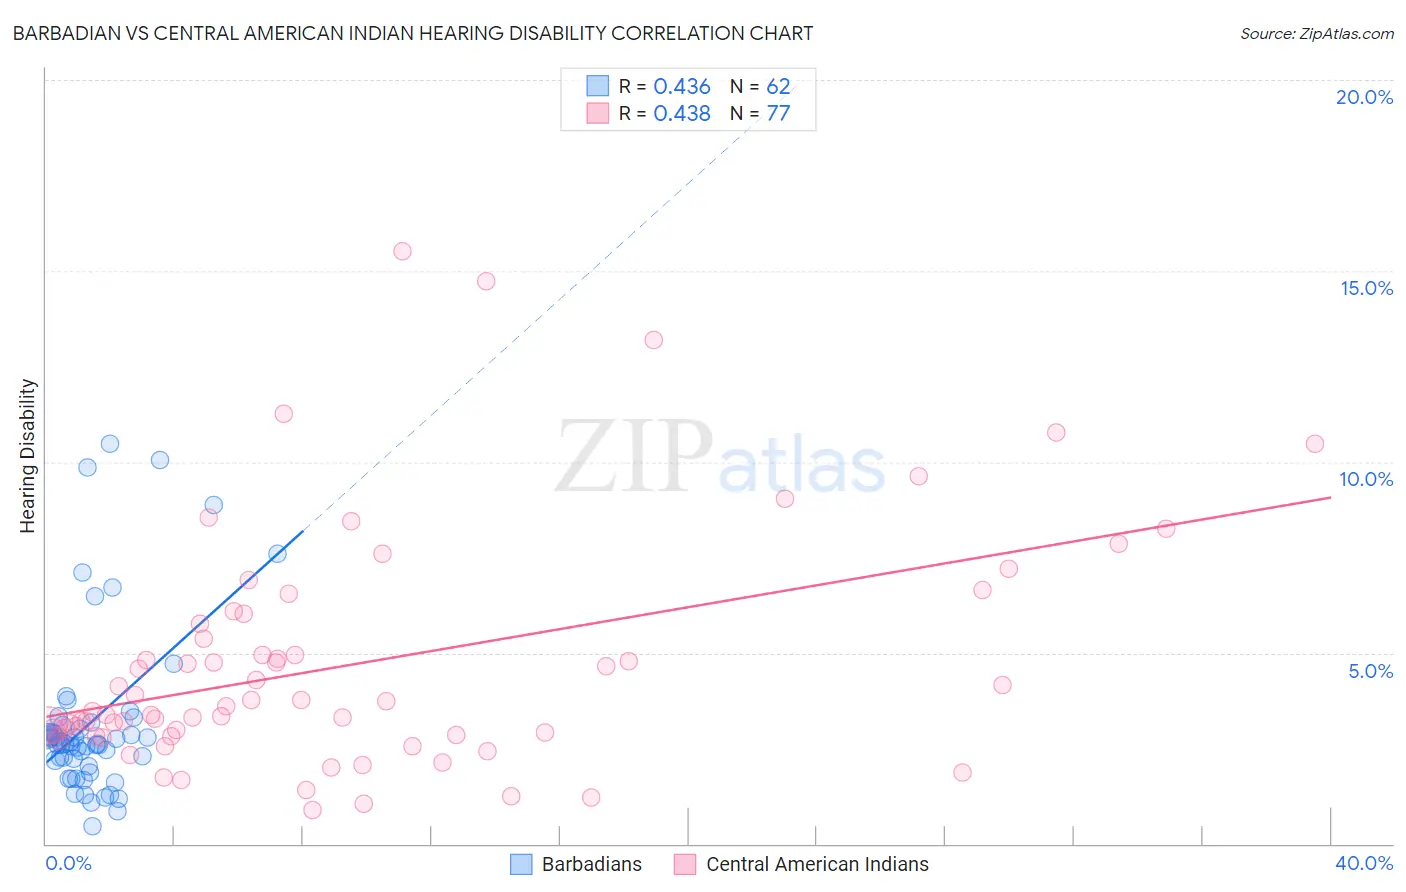
Barbadian vs Central American Indian Hearing Disability Correlation Chart
The statistical analysis conducted on geographies consisting of 141,290,556 people shows a moderate positive correlation between the proportion of Barbadians and percentage of population with hearing disability in the United States with a correlation coefficient (R) of 0.436 and weighted average of 2.5%. Similarly, the statistical analysis conducted on geographies consisting of 326,061,009 people shows a moderate positive correlation between the proportion of Central American Indians and percentage of population with hearing disability in the United States with a correlation coefficient (R) of 0.438 and weighted average of 3.3%, a difference of 29.4%.
Hearing Disability Correlation Summary
| Measurement | Barbadian | Central American Indian |
| Minimum | 0.47% | 0.88% |
| Maximum | 10.5% | 15.5% |
| Range | 10.0% | 14.6% |
| Mean | 3.2% | 4.7% |
| Median | 2.6% | 3.6% |
| Interquartile 25% (IQ1) | 2.2% | 2.8% |
| Interquartile 75% (IQ3) | 3.1% | 5.9% |
| Interquartile Range (IQR) | 0.91% | 3.1% |
| Standard Deviation (Sample) | 2.2% | 3.1% |
| Standard Deviation (Population) | 2.2% | 3.1% |
Similar Demographics by Hearing Disability
Demographics Similar to Barbadians by Hearing Disability
In terms of hearing disability, the demographic groups most similar to Barbadians are Immigrants from West Indies (2.5%, a difference of 0.15%), Ecuadorian (2.5%, a difference of 0.30%), Immigrants from India (2.5%, a difference of 0.47%), Sierra Leonean (2.5%, a difference of 0.62%), and Trinidadian and Tobagonian (2.5%, a difference of 0.85%).
| Demographics | Rating | Rank | Hearing Disability |
| British West Indians | 100.0 /100 | #8 | Exceptional 2.4% |
| Immigrants | Dominican Republic | 100.0 /100 | #9 | Exceptional 2.4% |
| Immigrants | Ecuador | 99.9 /100 | #10 | Exceptional 2.5% |
| Immigrants | Trinidad and Tobago | 99.9 /100 | #11 | Exceptional 2.5% |
| Trinidadians and Tobagonians | 99.9 /100 | #12 | Exceptional 2.5% |
| Sierra Leoneans | 99.9 /100 | #13 | Exceptional 2.5% |
| Ecuadorians | 99.9 /100 | #14 | Exceptional 2.5% |
| Barbadians | 99.9 /100 | #15 | Exceptional 2.5% |
| Immigrants | West Indies | 99.9 /100 | #16 | Exceptional 2.5% |
| Immigrants | India | 99.9 /100 | #17 | Exceptional 2.5% |
| Dominicans | 99.8 /100 | #18 | Exceptional 2.5% |
| Thais | 99.8 /100 | #19 | Exceptional 2.5% |
| Immigrants | Bolivia | 99.8 /100 | #20 | Exceptional 2.5% |
| Ghanaians | 99.8 /100 | #21 | Exceptional 2.5% |
| Immigrants | Sierra Leone | 99.8 /100 | #22 | Exceptional 2.6% |
Demographics Similar to Central American Indians by Hearing Disability
In terms of hearing disability, the demographic groups most similar to Central American Indians are Estonian (3.3%, a difference of 0.070%), Guamanian/Chamorro (3.3%, a difference of 0.10%), Serbian (3.3%, a difference of 0.17%), Ukrainian (3.2%, a difference of 0.44%), and Luxembourger (3.2%, a difference of 0.49%).
| Demographics | Rating | Rank | Hearing Disability |
| Bhutanese | 4.6 /100 | #227 | Tragic 3.2% |
| Immigrants | Portugal | 4.3 /100 | #228 | Tragic 3.2% |
| Maltese | 4.1 /100 | #229 | Tragic 3.2% |
| Greeks | 3.2 /100 | #230 | Tragic 3.2% |
| Luxembourgers | 2.9 /100 | #231 | Tragic 3.2% |
| Ukrainians | 2.9 /100 | #232 | Tragic 3.2% |
| Estonians | 2.4 /100 | #233 | Tragic 3.3% |
| Central American Indians | 2.3 /100 | #234 | Tragic 3.3% |
| Guamanians/Chamorros | 2.2 /100 | #235 | Tragic 3.3% |
| Serbians | 2.2 /100 | #236 | Tragic 3.3% |
| Immigrants | Austria | 1.8 /100 | #237 | Tragic 3.3% |
| German Russians | 1.8 /100 | #238 | Tragic 3.3% |
| Nepalese | 1.2 /100 | #239 | Tragic 3.3% |
| Immigrants | Netherlands | 1.1 /100 | #240 | Tragic 3.3% |
| Samoans | 1.1 /100 | #241 | Tragic 3.3% |