Barbadian vs Immigrants from Spain Hearing Disability
COMPARE
Barbadian
Immigrants from Spain
Hearing Disability
Hearing Disability Comparison
Barbadians
Immigrants from Spain
2.5%
HEARING DISABILITY
99.9/ 100
METRIC RATING
15th/ 347
METRIC RANK
2.8%
HEARING DISABILITY
94.9/ 100
METRIC RATING
101st/ 347
METRIC RANK
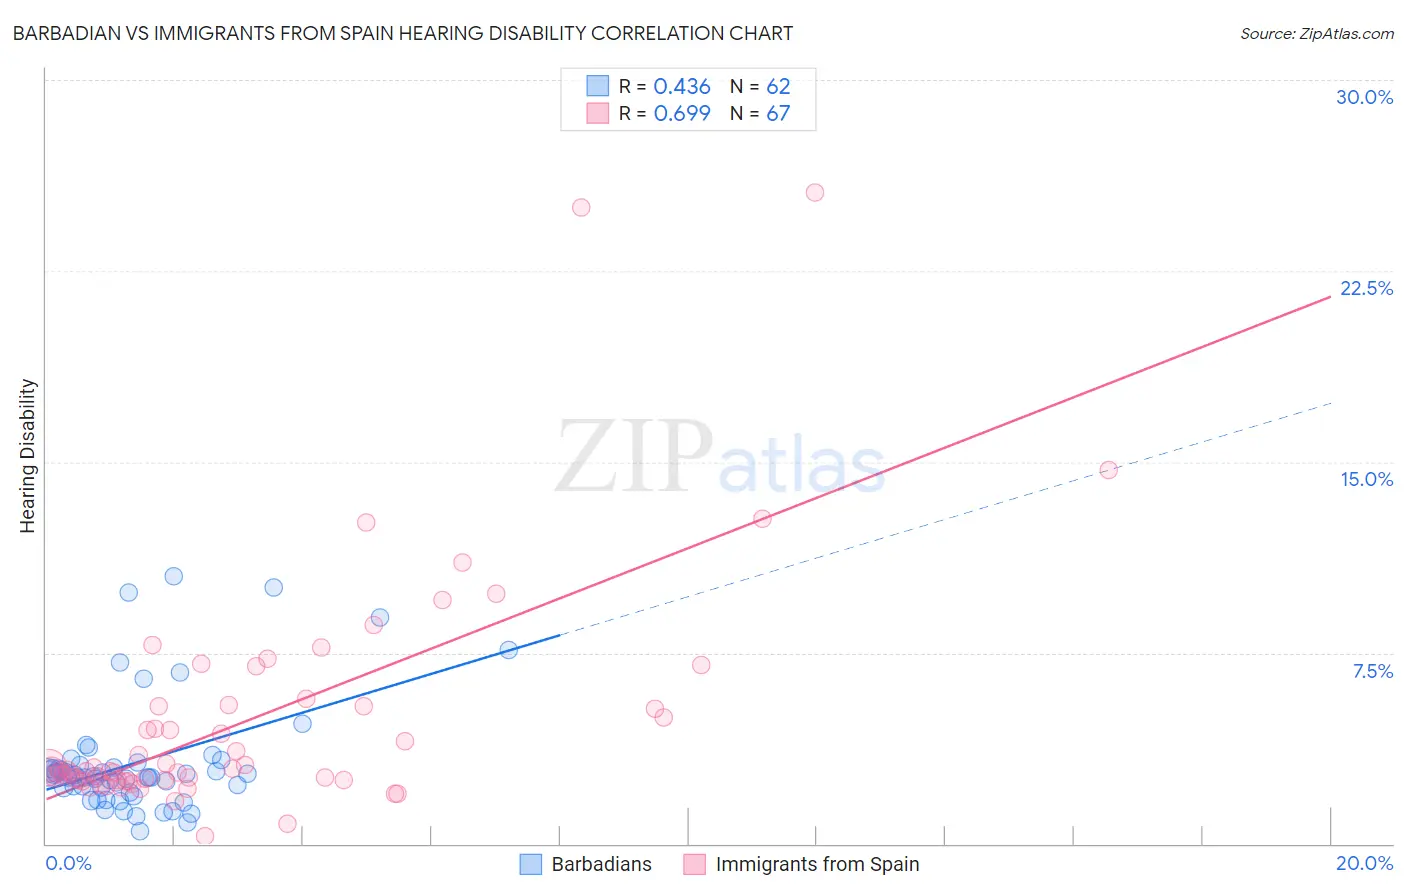
Barbadian vs Immigrants from Spain Hearing Disability Correlation Chart
The statistical analysis conducted on geographies consisting of 141,290,556 people shows a moderate positive correlation between the proportion of Barbadians and percentage of population with hearing disability in the United States with a correlation coefficient (R) of 0.436 and weighted average of 2.5%. Similarly, the statistical analysis conducted on geographies consisting of 239,646,131 people shows a significant positive correlation between the proportion of Immigrants from Spain and percentage of population with hearing disability in the United States with a correlation coefficient (R) of 0.699 and weighted average of 2.8%, a difference of 10.9%.
Hearing Disability Correlation Summary
| Measurement | Barbadian | Immigrants from Spain |
| Minimum | 0.47% | 0.32% |
| Maximum | 10.5% | 25.6% |
| Range | 10.0% | 25.3% |
| Mean | 3.2% | 4.9% |
| Median | 2.6% | 2.9% |
| Interquartile 25% (IQ1) | 2.2% | 2.5% |
| Interquartile 75% (IQ3) | 3.1% | 5.4% |
| Interquartile Range (IQR) | 0.91% | 2.9% |
| Standard Deviation (Sample) | 2.2% | 4.7% |
| Standard Deviation (Population) | 2.2% | 4.6% |
Similar Demographics by Hearing Disability
Demographics Similar to Barbadians by Hearing Disability
In terms of hearing disability, the demographic groups most similar to Barbadians are Immigrants from West Indies (2.5%, a difference of 0.15%), Ecuadorian (2.5%, a difference of 0.30%), Immigrants from India (2.5%, a difference of 0.47%), Sierra Leonean (2.5%, a difference of 0.62%), and Trinidadian and Tobagonian (2.5%, a difference of 0.85%).
| Demographics | Rating | Rank | Hearing Disability |
| British West Indians | 100.0 /100 | #8 | Exceptional 2.4% |
| Immigrants | Dominican Republic | 100.0 /100 | #9 | Exceptional 2.4% |
| Immigrants | Ecuador | 99.9 /100 | #10 | Exceptional 2.5% |
| Immigrants | Trinidad and Tobago | 99.9 /100 | #11 | Exceptional 2.5% |
| Trinidadians and Tobagonians | 99.9 /100 | #12 | Exceptional 2.5% |
| Sierra Leoneans | 99.9 /100 | #13 | Exceptional 2.5% |
| Ecuadorians | 99.9 /100 | #14 | Exceptional 2.5% |
| Barbadians | 99.9 /100 | #15 | Exceptional 2.5% |
| Immigrants | West Indies | 99.9 /100 | #16 | Exceptional 2.5% |
| Immigrants | India | 99.9 /100 | #17 | Exceptional 2.5% |
| Dominicans | 99.8 /100 | #18 | Exceptional 2.5% |
| Thais | 99.8 /100 | #19 | Exceptional 2.5% |
| Immigrants | Bolivia | 99.8 /100 | #20 | Exceptional 2.5% |
| Ghanaians | 99.8 /100 | #21 | Exceptional 2.5% |
| Immigrants | Sierra Leone | 99.8 /100 | #22 | Exceptional 2.6% |
Demographics Similar to Immigrants from Spain by Hearing Disability
In terms of hearing disability, the demographic groups most similar to Immigrants from Spain are Taiwanese (2.8%, a difference of 0.010%), Immigrants from Eastern Africa (2.8%, a difference of 0.050%), Immigrants from Indonesia (2.8%, a difference of 0.060%), Immigrants from Guatemala (2.8%, a difference of 0.11%), and Immigrants from Honduras (2.8%, a difference of 0.15%).
| Demographics | Rating | Rank | Hearing Disability |
| Uruguayans | 95.9 /100 | #94 | Exceptional 2.8% |
| Israelis | 95.9 /100 | #95 | Exceptional 2.8% |
| Immigrants | Somalia | 95.5 /100 | #96 | Exceptional 2.8% |
| Immigrants | Afghanistan | 95.3 /100 | #97 | Exceptional 2.8% |
| Immigrants | Honduras | 95.1 /100 | #98 | Exceptional 2.8% |
| Immigrants | Guatemala | 95.1 /100 | #99 | Exceptional 2.8% |
| Immigrants | Eastern Africa | 95.0 /100 | #100 | Exceptional 2.8% |
| Immigrants | Spain | 94.9 /100 | #101 | Exceptional 2.8% |
| Taiwanese | 94.8 /100 | #102 | Exceptional 2.8% |
| Immigrants | Indonesia | 94.7 /100 | #103 | Exceptional 2.8% |
| Burmese | 94.2 /100 | #104 | Exceptional 2.8% |
| Moroccans | 93.9 /100 | #105 | Exceptional 2.8% |
| Hondurans | 93.4 /100 | #106 | Exceptional 2.8% |
| Immigrants | Chile | 93.4 /100 | #107 | Exceptional 2.8% |
| Guatemalans | 93.2 /100 | #108 | Exceptional 2.8% |