Basque vs Central American Indian Hearing Disability
COMPARE
Basque
Central American Indian
Hearing Disability
Hearing Disability Comparison
Basques
Central American Indians
3.6%
HEARING DISABILITY
0.0/ 100
METRIC RATING
278th/ 347
METRIC RANK
3.3%
HEARING DISABILITY
2.3/ 100
METRIC RATING
234th/ 347
METRIC RANK
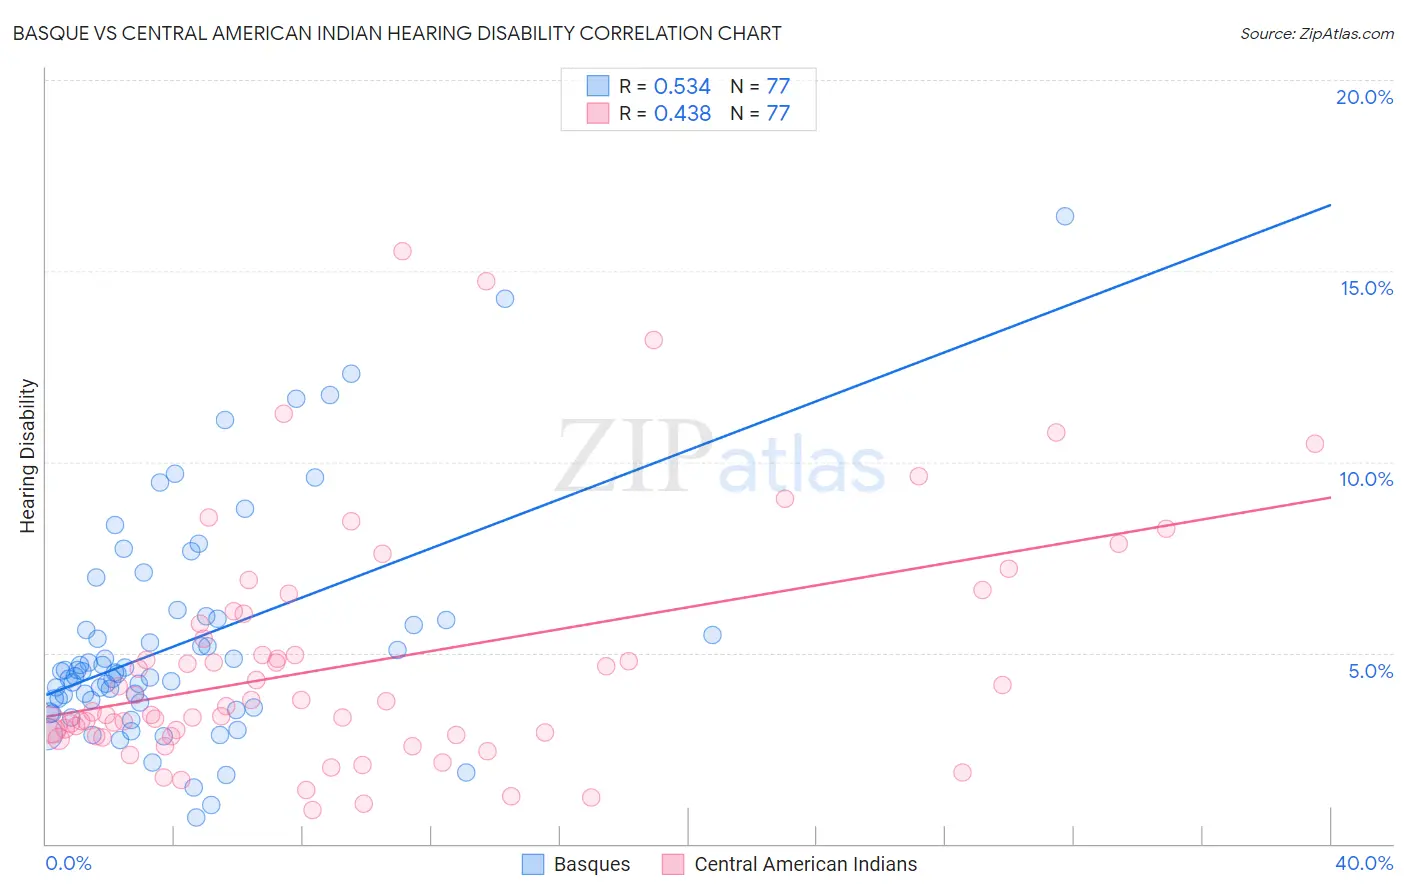
Basque vs Central American Indian Hearing Disability Correlation Chart
The statistical analysis conducted on geographies consisting of 165,769,952 people shows a substantial positive correlation between the proportion of Basques and percentage of population with hearing disability in the United States with a correlation coefficient (R) of 0.534 and weighted average of 3.6%. Similarly, the statistical analysis conducted on geographies consisting of 326,061,009 people shows a moderate positive correlation between the proportion of Central American Indians and percentage of population with hearing disability in the United States with a correlation coefficient (R) of 0.438 and weighted average of 3.3%, a difference of 10.3%.
Hearing Disability Correlation Summary
| Measurement | Basque | Central American Indian |
| Minimum | 0.68% | 0.88% |
| Maximum | 16.4% | 15.5% |
| Range | 15.7% | 14.6% |
| Mean | 5.3% | 4.7% |
| Median | 4.5% | 3.6% |
| Interquartile 25% (IQ1) | 3.6% | 2.8% |
| Interquartile 75% (IQ3) | 5.9% | 5.9% |
| Interquartile Range (IQR) | 2.2% | 3.1% |
| Standard Deviation (Sample) | 2.9% | 3.1% |
| Standard Deviation (Population) | 2.9% | 3.1% |
Similar Demographics by Hearing Disability
Demographics Similar to Basques by Hearing Disability
In terms of hearing disability, the demographic groups most similar to Basques are Slovak (3.6%, a difference of 0.26%), French American Indian (3.6%, a difference of 0.33%), Nonimmigrants (3.6%, a difference of 0.39%), Scandinavian (3.6%, a difference of 0.39%), and Swedish (3.6%, a difference of 0.48%).
| Demographics | Rating | Rank | Hearing Disability |
| Czechs | 0.1 /100 | #271 | Tragic 3.5% |
| Fijians | 0.0 /100 | #272 | Tragic 3.5% |
| Puerto Ricans | 0.0 /100 | #273 | Tragic 3.5% |
| Swiss | 0.0 /100 | #274 | Tragic 3.5% |
| Czechoslovakians | 0.0 /100 | #275 | Tragic 3.6% |
| Danes | 0.0 /100 | #276 | Tragic 3.6% |
| Immigrants | Nonimmigrants | 0.0 /100 | #277 | Tragic 3.6% |
| Basques | 0.0 /100 | #278 | Tragic 3.6% |
| Slovaks | 0.0 /100 | #279 | Tragic 3.6% |
| French American Indians | 0.0 /100 | #280 | Tragic 3.6% |
| Scandinavians | 0.0 /100 | #281 | Tragic 3.6% |
| Swedes | 0.0 /100 | #282 | Tragic 3.6% |
| Blackfeet | 0.0 /100 | #283 | Tragic 3.6% |
| Immigrants | Micronesia | 0.0 /100 | #284 | Tragic 3.6% |
| Sioux | 0.0 /100 | #285 | Tragic 3.6% |
Demographics Similar to Central American Indians by Hearing Disability
In terms of hearing disability, the demographic groups most similar to Central American Indians are Estonian (3.3%, a difference of 0.070%), Guamanian/Chamorro (3.3%, a difference of 0.10%), Serbian (3.3%, a difference of 0.17%), Ukrainian (3.2%, a difference of 0.44%), and Luxembourger (3.2%, a difference of 0.49%).
| Demographics | Rating | Rank | Hearing Disability |
| Bhutanese | 4.6 /100 | #227 | Tragic 3.2% |
| Immigrants | Portugal | 4.3 /100 | #228 | Tragic 3.2% |
| Maltese | 4.1 /100 | #229 | Tragic 3.2% |
| Greeks | 3.2 /100 | #230 | Tragic 3.2% |
| Luxembourgers | 2.9 /100 | #231 | Tragic 3.2% |
| Ukrainians | 2.9 /100 | #232 | Tragic 3.2% |
| Estonians | 2.4 /100 | #233 | Tragic 3.3% |
| Central American Indians | 2.3 /100 | #234 | Tragic 3.3% |
| Guamanians/Chamorros | 2.2 /100 | #235 | Tragic 3.3% |
| Serbians | 2.2 /100 | #236 | Tragic 3.3% |
| Immigrants | Austria | 1.8 /100 | #237 | Tragic 3.3% |
| German Russians | 1.8 /100 | #238 | Tragic 3.3% |
| Nepalese | 1.2 /100 | #239 | Tragic 3.3% |
| Immigrants | Netherlands | 1.1 /100 | #240 | Tragic 3.3% |
| Samoans | 1.1 /100 | #241 | Tragic 3.3% |