Immigrants from Northern Africa vs Central American Indian Hearing Disability
COMPARE
Immigrants from Northern Africa
Central American Indian
Hearing Disability
Hearing Disability Comparison
Immigrants from Northern Africa
Central American Indians
2.8%
HEARING DISABILITY
96.9/ 100
METRIC RATING
85th/ 347
METRIC RANK
3.3%
HEARING DISABILITY
2.3/ 100
METRIC RATING
234th/ 347
METRIC RANK
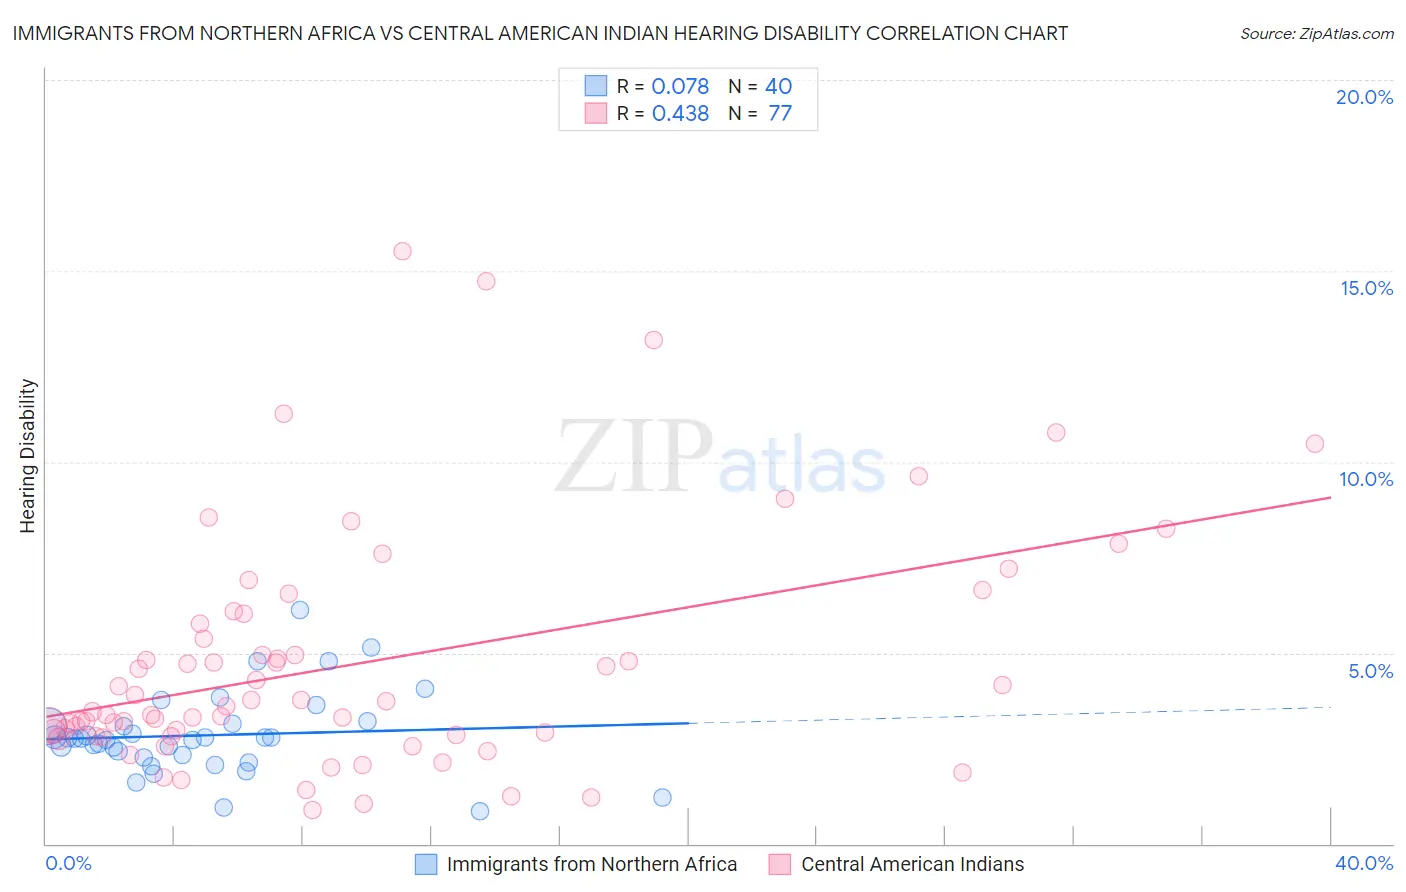
Immigrants from Northern Africa vs Central American Indian Hearing Disability Correlation Chart
The statistical analysis conducted on geographies consisting of 321,108,850 people shows a slight positive correlation between the proportion of Immigrants from Northern Africa and percentage of population with hearing disability in the United States with a correlation coefficient (R) of 0.078 and weighted average of 2.8%. Similarly, the statistical analysis conducted on geographies consisting of 326,061,009 people shows a moderate positive correlation between the proportion of Central American Indians and percentage of population with hearing disability in the United States with a correlation coefficient (R) of 0.438 and weighted average of 3.3%, a difference of 18.3%.
Hearing Disability Correlation Summary
| Measurement | Immigrants from Northern Africa | Central American Indian |
| Minimum | 0.86% | 0.88% |
| Maximum | 6.1% | 15.5% |
| Range | 5.3% | 14.6% |
| Mean | 2.8% | 4.7% |
| Median | 2.8% | 3.6% |
| Interquartile 25% (IQ1) | 2.3% | 2.8% |
| Interquartile 75% (IQ3) | 3.1% | 5.9% |
| Interquartile Range (IQR) | 0.81% | 3.1% |
| Standard Deviation (Sample) | 1.1% | 3.1% |
| Standard Deviation (Population) | 1.1% | 3.1% |
Similar Demographics by Hearing Disability
Demographics Similar to Immigrants from Northern Africa by Hearing Disability
In terms of hearing disability, the demographic groups most similar to Immigrants from Northern Africa are Immigrants from Iran (2.8%, a difference of 0.020%), Immigrants from Argentina (2.8%, a difference of 0.070%), Somali (2.8%, a difference of 0.13%), Immigrants from Turkey (2.8%, a difference of 0.17%), and Belizean (2.8%, a difference of 0.20%).
| Demographics | Rating | Rank | Hearing Disability |
| Mongolians | 97.4 /100 | #78 | Exceptional 2.7% |
| Colombians | 97.4 /100 | #79 | Exceptional 2.7% |
| Immigrants | Asia | 97.2 /100 | #80 | Exceptional 2.7% |
| Immigrants | Uruguay | 97.2 /100 | #81 | Exceptional 2.7% |
| Immigrants | Armenia | 97.2 /100 | #82 | Exceptional 2.7% |
| Immigrants | Cuba | 97.2 /100 | #83 | Exceptional 2.7% |
| Immigrants | Argentina | 97.0 /100 | #84 | Exceptional 2.8% |
| Immigrants | Northern Africa | 96.9 /100 | #85 | Exceptional 2.8% |
| Immigrants | Iran | 96.8 /100 | #86 | Exceptional 2.8% |
| Somalis | 96.7 /100 | #87 | Exceptional 2.8% |
| Immigrants | Turkey | 96.7 /100 | #88 | Exceptional 2.8% |
| Belizeans | 96.6 /100 | #89 | Exceptional 2.8% |
| Immigrants | Morocco | 96.6 /100 | #90 | Exceptional 2.8% |
| Immigrants | Middle Africa | 96.5 /100 | #91 | Exceptional 2.8% |
| Iranians | 96.4 /100 | #92 | Exceptional 2.8% |
Demographics Similar to Central American Indians by Hearing Disability
In terms of hearing disability, the demographic groups most similar to Central American Indians are Estonian (3.3%, a difference of 0.070%), Guamanian/Chamorro (3.3%, a difference of 0.10%), Serbian (3.3%, a difference of 0.17%), Ukrainian (3.2%, a difference of 0.44%), and Luxembourger (3.2%, a difference of 0.49%).
| Demographics | Rating | Rank | Hearing Disability |
| Bhutanese | 4.6 /100 | #227 | Tragic 3.2% |
| Immigrants | Portugal | 4.3 /100 | #228 | Tragic 3.2% |
| Maltese | 4.1 /100 | #229 | Tragic 3.2% |
| Greeks | 3.2 /100 | #230 | Tragic 3.2% |
| Luxembourgers | 2.9 /100 | #231 | Tragic 3.2% |
| Ukrainians | 2.9 /100 | #232 | Tragic 3.2% |
| Estonians | 2.4 /100 | #233 | Tragic 3.3% |
| Central American Indians | 2.3 /100 | #234 | Tragic 3.3% |
| Guamanians/Chamorros | 2.2 /100 | #235 | Tragic 3.3% |
| Serbians | 2.2 /100 | #236 | Tragic 3.3% |
| Immigrants | Austria | 1.8 /100 | #237 | Tragic 3.3% |
| German Russians | 1.8 /100 | #238 | Tragic 3.3% |
| Nepalese | 1.2 /100 | #239 | Tragic 3.3% |
| Immigrants | Netherlands | 1.1 /100 | #240 | Tragic 3.3% |
| Samoans | 1.1 /100 | #241 | Tragic 3.3% |