Celtic vs Central American Indian Hearing Disability
COMPARE
Celtic
Central American Indian
Hearing Disability
Hearing Disability Comparison
Celtics
Central American Indians
3.7%
HEARING DISABILITY
0.0/ 100
METRIC RATING
298th/ 347
METRIC RANK
3.3%
HEARING DISABILITY
2.3/ 100
METRIC RATING
234th/ 347
METRIC RANK
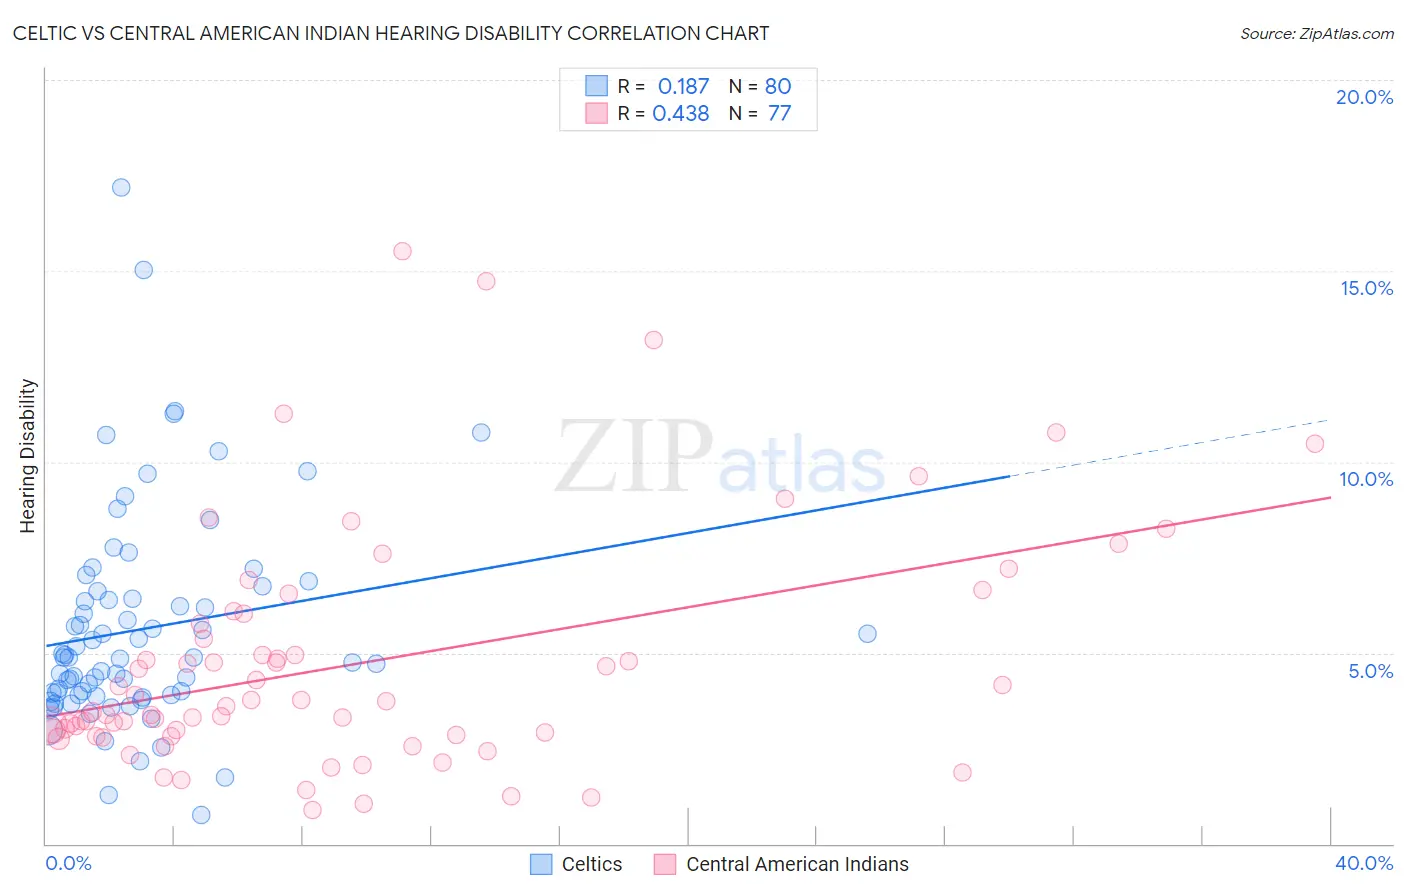
Celtic vs Central American Indian Hearing Disability Correlation Chart
The statistical analysis conducted on geographies consisting of 168,857,428 people shows a poor positive correlation between the proportion of Celtics and percentage of population with hearing disability in the United States with a correlation coefficient (R) of 0.187 and weighted average of 3.7%. Similarly, the statistical analysis conducted on geographies consisting of 326,061,009 people shows a moderate positive correlation between the proportion of Central American Indians and percentage of population with hearing disability in the United States with a correlation coefficient (R) of 0.438 and weighted average of 3.3%, a difference of 14.3%.
Hearing Disability Correlation Summary
| Measurement | Celtic | Central American Indian |
| Minimum | 0.76% | 0.88% |
| Maximum | 17.2% | 15.5% |
| Range | 16.4% | 14.6% |
| Mean | 5.6% | 4.7% |
| Median | 4.9% | 3.6% |
| Interquartile 25% (IQ1) | 3.9% | 2.8% |
| Interquartile 75% (IQ3) | 6.5% | 5.9% |
| Interquartile Range (IQR) | 2.6% | 3.1% |
| Standard Deviation (Sample) | 2.8% | 3.1% |
| Standard Deviation (Population) | 2.8% | 3.1% |
Similar Demographics by Hearing Disability
Demographics Similar to Celtics by Hearing Disability
In terms of hearing disability, the demographic groups most similar to Celtics are Immigrants from the Azores (3.7%, a difference of 0.19%), Pima (3.7%, a difference of 0.26%), German (3.7%, a difference of 0.28%), Scottish (3.7%, a difference of 0.34%), and Pennsylvania German (3.7%, a difference of 0.37%).
| Demographics | Rating | Rank | Hearing Disability |
| Finns | 0.0 /100 | #291 | Tragic 3.7% |
| Native Hawaiians | 0.0 /100 | #292 | Tragic 3.7% |
| Norwegians | 0.0 /100 | #293 | Tragic 3.7% |
| Iroquois | 0.0 /100 | #294 | Tragic 3.7% |
| Welsh | 0.0 /100 | #295 | Tragic 3.7% |
| Pima | 0.0 /100 | #296 | Tragic 3.7% |
| Immigrants | Azores | 0.0 /100 | #297 | Tragic 3.7% |
| Celtics | 0.0 /100 | #298 | Tragic 3.7% |
| Germans | 0.0 /100 | #299 | Tragic 3.7% |
| Scottish | 0.0 /100 | #300 | Tragic 3.7% |
| Pennsylvania Germans | 0.0 /100 | #301 | Tragic 3.7% |
| Dutch | 0.0 /100 | #302 | Tragic 3.7% |
| Menominee | 0.0 /100 | #303 | Tragic 3.7% |
| French | 0.0 /100 | #304 | Tragic 3.8% |
| English | 0.0 /100 | #305 | Tragic 3.8% |
Demographics Similar to Central American Indians by Hearing Disability
In terms of hearing disability, the demographic groups most similar to Central American Indians are Estonian (3.3%, a difference of 0.070%), Guamanian/Chamorro (3.3%, a difference of 0.10%), Serbian (3.3%, a difference of 0.17%), Ukrainian (3.2%, a difference of 0.44%), and Luxembourger (3.2%, a difference of 0.49%).
| Demographics | Rating | Rank | Hearing Disability |
| Bhutanese | 4.6 /100 | #227 | Tragic 3.2% |
| Immigrants | Portugal | 4.3 /100 | #228 | Tragic 3.2% |
| Maltese | 4.1 /100 | #229 | Tragic 3.2% |
| Greeks | 3.2 /100 | #230 | Tragic 3.2% |
| Luxembourgers | 2.9 /100 | #231 | Tragic 3.2% |
| Ukrainians | 2.9 /100 | #232 | Tragic 3.2% |
| Estonians | 2.4 /100 | #233 | Tragic 3.3% |
| Central American Indians | 2.3 /100 | #234 | Tragic 3.3% |
| Guamanians/Chamorros | 2.2 /100 | #235 | Tragic 3.3% |
| Serbians | 2.2 /100 | #236 | Tragic 3.3% |
| Immigrants | Austria | 1.8 /100 | #237 | Tragic 3.3% |
| German Russians | 1.8 /100 | #238 | Tragic 3.3% |
| Nepalese | 1.2 /100 | #239 | Tragic 3.3% |
| Immigrants | Netherlands | 1.1 /100 | #240 | Tragic 3.3% |
| Samoans | 1.1 /100 | #241 | Tragic 3.3% |