Barbadian vs Immigrants from Sierra Leone Hearing Disability
COMPARE
Barbadian
Immigrants from Sierra Leone
Hearing Disability
Hearing Disability Comparison
Barbadians
Immigrants from Sierra Leone
2.5%
HEARING DISABILITY
99.9/ 100
METRIC RATING
15th/ 347
METRIC RANK
2.6%
HEARING DISABILITY
99.8/ 100
METRIC RATING
22nd/ 347
METRIC RANK
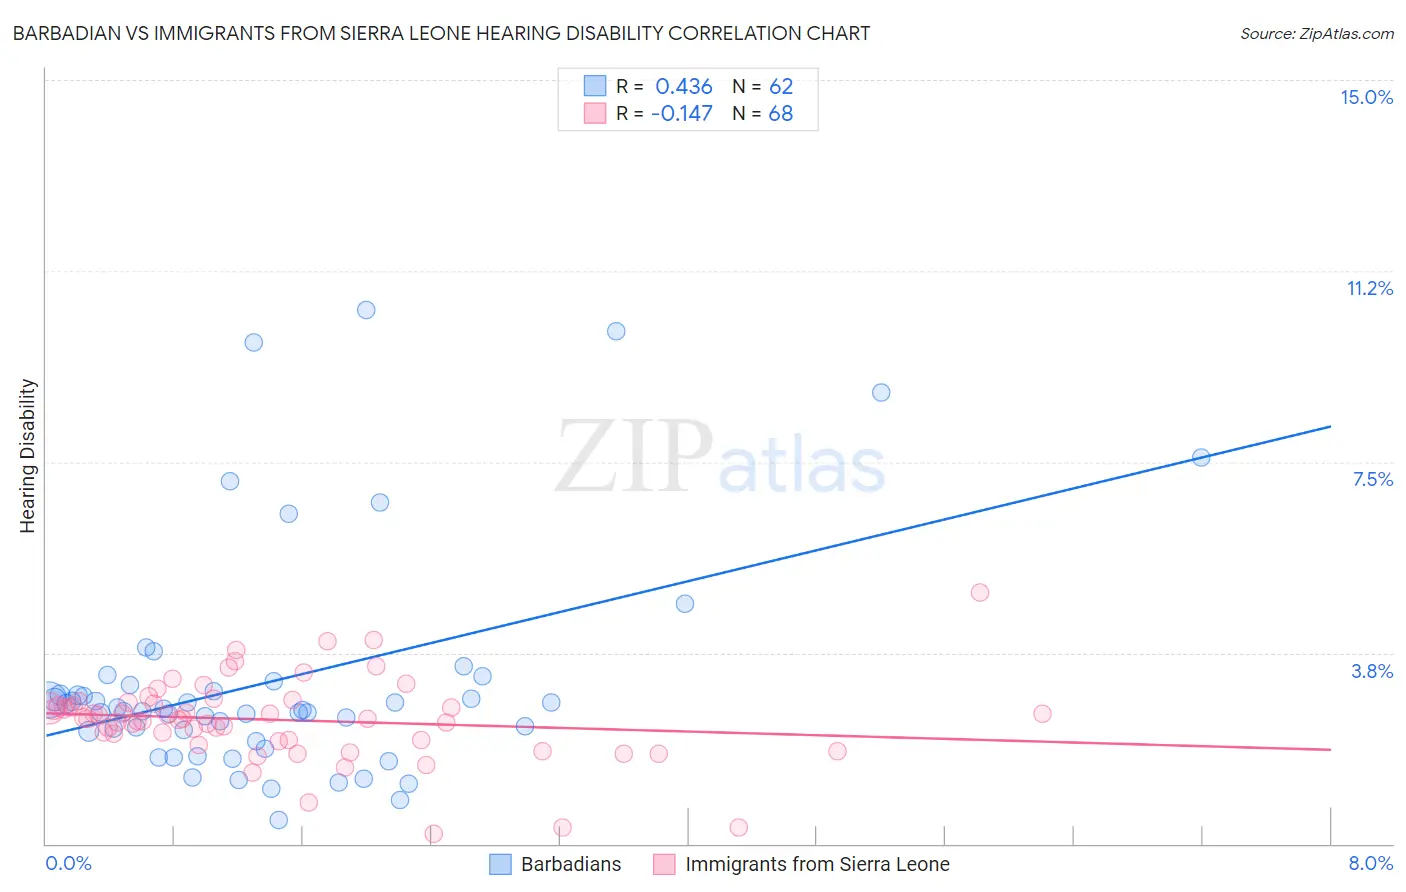
Barbadian vs Immigrants from Sierra Leone Hearing Disability Correlation Chart
The statistical analysis conducted on geographies consisting of 141,290,556 people shows a moderate positive correlation between the proportion of Barbadians and percentage of population with hearing disability in the United States with a correlation coefficient (R) of 0.436 and weighted average of 2.5%. Similarly, the statistical analysis conducted on geographies consisting of 101,639,141 people shows a poor negative correlation between the proportion of Immigrants from Sierra Leone and percentage of population with hearing disability in the United States with a correlation coefficient (R) of -0.147 and weighted average of 2.6%, a difference of 1.3%.
Hearing Disability Correlation Summary
| Measurement | Barbadian | Immigrants from Sierra Leone |
| Minimum | 0.47% | 0.20% |
| Maximum | 10.5% | 4.9% |
| Range | 10.0% | 4.7% |
| Mean | 3.2% | 2.4% |
| Median | 2.6% | 2.5% |
| Interquartile 25% (IQ1) | 2.2% | 2.0% |
| Interquartile 75% (IQ3) | 3.1% | 2.8% |
| Interquartile Range (IQR) | 0.91% | 0.72% |
| Standard Deviation (Sample) | 2.2% | 0.81% |
| Standard Deviation (Population) | 2.2% | 0.80% |
Demographics Similar to Barbadians and Immigrants from Sierra Leone by Hearing Disability
In terms of hearing disability, the demographic groups most similar to Barbadians are Immigrants from West Indies (2.5%, a difference of 0.15%), Ecuadorian (2.5%, a difference of 0.30%), Immigrants from India (2.5%, a difference of 0.47%), Sierra Leonean (2.5%, a difference of 0.62%), and Trinidadian and Tobagonian (2.5%, a difference of 0.85%). Similarly, the demographic groups most similar to Immigrants from Sierra Leone are Ghanaian (2.5%, a difference of 0.040%), Immigrants from Bolivia (2.5%, a difference of 0.11%), Thai (2.5%, a difference of 0.16%), Dominican (2.5%, a difference of 0.18%), and Immigrants from Nigeria (2.6%, a difference of 0.50%).
| Demographics | Rating | Rank | Hearing Disability |
| British West Indians | 100.0 /100 | #8 | Exceptional 2.4% |
| Immigrants | Dominican Republic | 100.0 /100 | #9 | Exceptional 2.4% |
| Immigrants | Ecuador | 99.9 /100 | #10 | Exceptional 2.5% |
| Immigrants | Trinidad and Tobago | 99.9 /100 | #11 | Exceptional 2.5% |
| Trinidadians and Tobagonians | 99.9 /100 | #12 | Exceptional 2.5% |
| Sierra Leoneans | 99.9 /100 | #13 | Exceptional 2.5% |
| Ecuadorians | 99.9 /100 | #14 | Exceptional 2.5% |
| Barbadians | 99.9 /100 | #15 | Exceptional 2.5% |
| Immigrants | West Indies | 99.9 /100 | #16 | Exceptional 2.5% |
| Immigrants | India | 99.9 /100 | #17 | Exceptional 2.5% |
| Dominicans | 99.8 /100 | #18 | Exceptional 2.5% |
| Thais | 99.8 /100 | #19 | Exceptional 2.5% |
| Immigrants | Bolivia | 99.8 /100 | #20 | Exceptional 2.5% |
| Ghanaians | 99.8 /100 | #21 | Exceptional 2.5% |
| Immigrants | Sierra Leone | 99.8 /100 | #22 | Exceptional 2.6% |
| Immigrants | Nigeria | 99.8 /100 | #23 | Exceptional 2.6% |
| Immigrants | Ghana | 99.8 /100 | #24 | Exceptional 2.6% |
| Immigrants | El Salvador | 99.7 /100 | #25 | Exceptional 2.6% |
| Immigrants | Senegal | 99.7 /100 | #26 | Exceptional 2.6% |
| Immigrants | South Central Asia | 99.7 /100 | #27 | Exceptional 2.6% |
| Immigrants | Haiti | 99.7 /100 | #28 | Exceptional 2.6% |