Barbadian vs Puerto Rican Hearing Disability
COMPARE
Barbadian
Puerto Rican
Hearing Disability
Hearing Disability Comparison
Barbadians
Puerto Ricans
2.5%
HEARING DISABILITY
99.9/ 100
METRIC RATING
15th/ 347
METRIC RANK
3.5%
HEARING DISABILITY
0.0/ 100
METRIC RATING
273rd/ 347
METRIC RANK
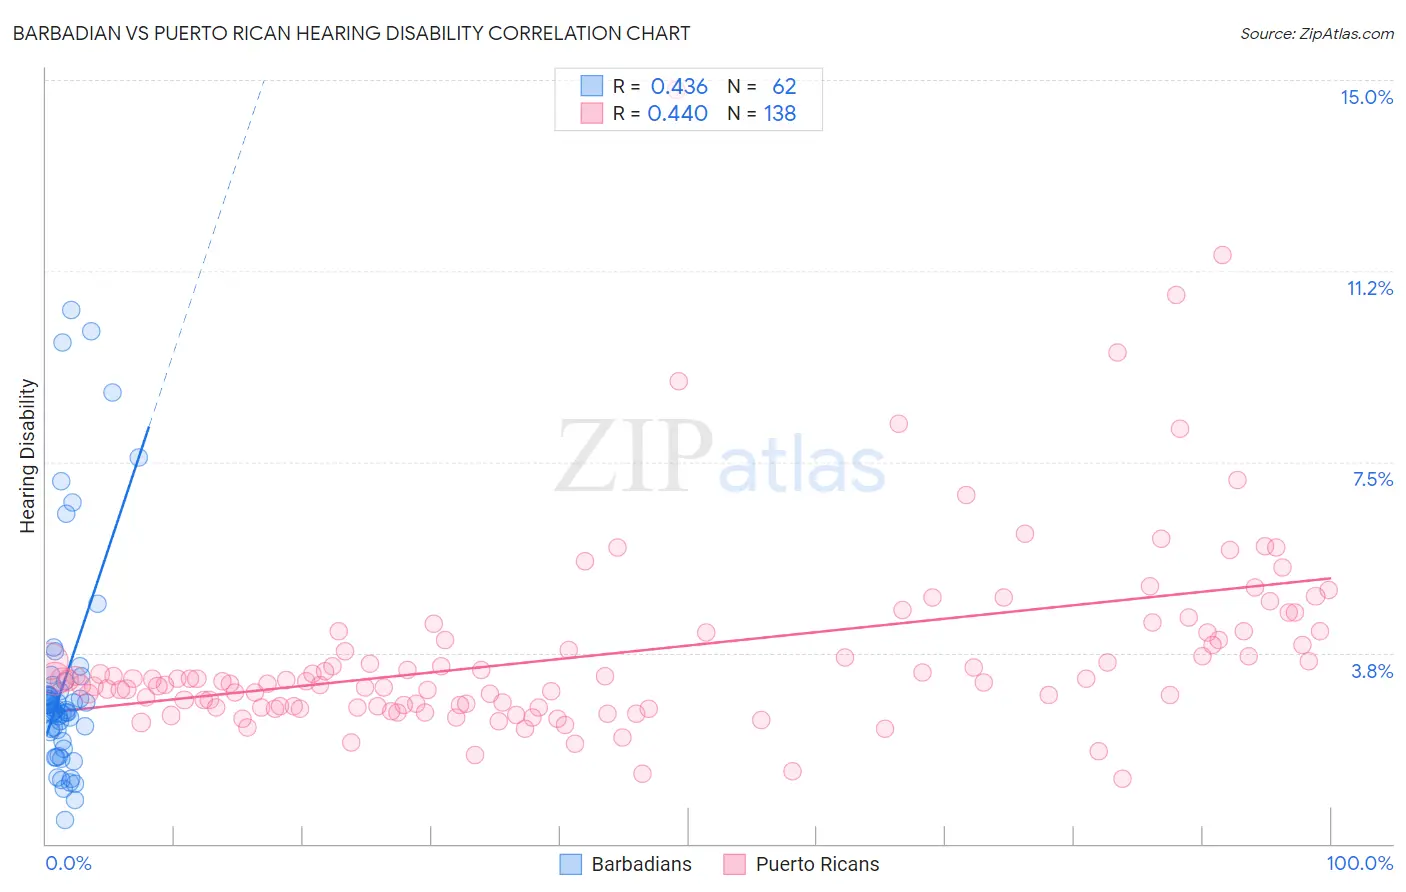
Barbadian vs Puerto Rican Hearing Disability Correlation Chart
The statistical analysis conducted on geographies consisting of 141,290,556 people shows a moderate positive correlation between the proportion of Barbadians and percentage of population with hearing disability in the United States with a correlation coefficient (R) of 0.436 and weighted average of 2.5%. Similarly, the statistical analysis conducted on geographies consisting of 527,769,112 people shows a moderate positive correlation between the proportion of Puerto Ricans and percentage of population with hearing disability in the United States with a correlation coefficient (R) of 0.440 and weighted average of 3.5%, a difference of 40.4%.
Hearing Disability Correlation Summary
| Measurement | Barbadian | Puerto Rican |
| Minimum | 0.47% | 1.3% |
| Maximum | 10.5% | 14.8% |
| Range | 10.0% | 13.5% |
| Mean | 3.2% | 3.7% |
| Median | 2.6% | 3.2% |
| Interquartile 25% (IQ1) | 2.2% | 2.7% |
| Interquartile 75% (IQ3) | 3.1% | 4.1% |
| Interquartile Range (IQR) | 0.91% | 1.4% |
| Standard Deviation (Sample) | 2.2% | 1.9% |
| Standard Deviation (Population) | 2.2% | 1.9% |
Similar Demographics by Hearing Disability
Demographics Similar to Barbadians by Hearing Disability
In terms of hearing disability, the demographic groups most similar to Barbadians are Immigrants from West Indies (2.5%, a difference of 0.15%), Ecuadorian (2.5%, a difference of 0.30%), Immigrants from India (2.5%, a difference of 0.47%), Sierra Leonean (2.5%, a difference of 0.62%), and Trinidadian and Tobagonian (2.5%, a difference of 0.85%).
| Demographics | Rating | Rank | Hearing Disability |
| British West Indians | 100.0 /100 | #8 | Exceptional 2.4% |
| Immigrants | Dominican Republic | 100.0 /100 | #9 | Exceptional 2.4% |
| Immigrants | Ecuador | 99.9 /100 | #10 | Exceptional 2.5% |
| Immigrants | Trinidad and Tobago | 99.9 /100 | #11 | Exceptional 2.5% |
| Trinidadians and Tobagonians | 99.9 /100 | #12 | Exceptional 2.5% |
| Sierra Leoneans | 99.9 /100 | #13 | Exceptional 2.5% |
| Ecuadorians | 99.9 /100 | #14 | Exceptional 2.5% |
| Barbadians | 99.9 /100 | #15 | Exceptional 2.5% |
| Immigrants | West Indies | 99.9 /100 | #16 | Exceptional 2.5% |
| Immigrants | India | 99.9 /100 | #17 | Exceptional 2.5% |
| Dominicans | 99.8 /100 | #18 | Exceptional 2.5% |
| Thais | 99.8 /100 | #19 | Exceptional 2.5% |
| Immigrants | Bolivia | 99.8 /100 | #20 | Exceptional 2.5% |
| Ghanaians | 99.8 /100 | #21 | Exceptional 2.5% |
| Immigrants | Sierra Leone | 99.8 /100 | #22 | Exceptional 2.6% |
Demographics Similar to Puerto Ricans by Hearing Disability
In terms of hearing disability, the demographic groups most similar to Puerto Ricans are Fijian (3.5%, a difference of 0.070%), Swiss (3.5%, a difference of 0.32%), Czech (3.5%, a difference of 0.33%), Czechoslovakian (3.6%, a difference of 0.53%), and European (3.5%, a difference of 0.59%).
| Demographics | Rating | Rank | Hearing Disability |
| Belgians | 0.1 /100 | #266 | Tragic 3.5% |
| Canadians | 0.1 /100 | #267 | Tragic 3.5% |
| Spaniards | 0.1 /100 | #268 | Tragic 3.5% |
| Ute | 0.1 /100 | #269 | Tragic 3.5% |
| Europeans | 0.1 /100 | #270 | Tragic 3.5% |
| Czechs | 0.1 /100 | #271 | Tragic 3.5% |
| Fijians | 0.0 /100 | #272 | Tragic 3.5% |
| Puerto Ricans | 0.0 /100 | #273 | Tragic 3.5% |
| Swiss | 0.0 /100 | #274 | Tragic 3.5% |
| Czechoslovakians | 0.0 /100 | #275 | Tragic 3.6% |
| Danes | 0.0 /100 | #276 | Tragic 3.6% |
| Immigrants | Nonimmigrants | 0.0 /100 | #277 | Tragic 3.6% |
| Basques | 0.0 /100 | #278 | Tragic 3.6% |
| Slovaks | 0.0 /100 | #279 | Tragic 3.6% |
| French American Indians | 0.0 /100 | #280 | Tragic 3.6% |