Barbadian vs Immigrants from Denmark Hearing Disability
COMPARE
Barbadian
Immigrants from Denmark
Hearing Disability
Hearing Disability Comparison
Barbadians
Immigrants from Denmark
2.5%
HEARING DISABILITY
99.9/ 100
METRIC RATING
15th/ 347
METRIC RANK
3.1%
HEARING DISABILITY
16.2/ 100
METRIC RATING
203rd/ 347
METRIC RANK
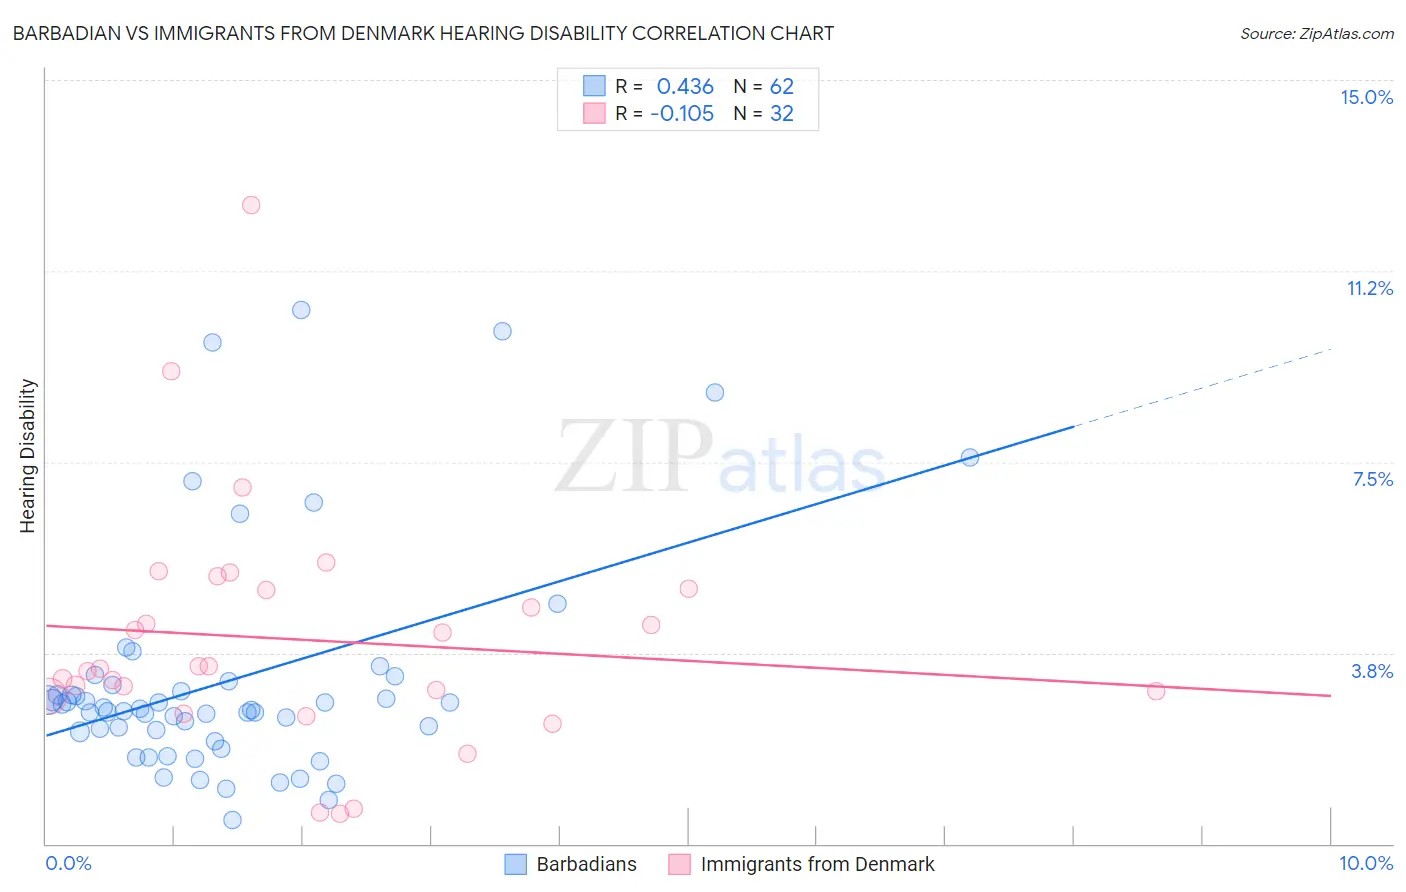
Barbadian vs Immigrants from Denmark Hearing Disability Correlation Chart
The statistical analysis conducted on geographies consisting of 141,290,556 people shows a moderate positive correlation between the proportion of Barbadians and percentage of population with hearing disability in the United States with a correlation coefficient (R) of 0.436 and weighted average of 2.5%. Similarly, the statistical analysis conducted on geographies consisting of 136,425,612 people shows a poor negative correlation between the proportion of Immigrants from Denmark and percentage of population with hearing disability in the United States with a correlation coefficient (R) of -0.105 and weighted average of 3.1%, a difference of 23.6%.
Hearing Disability Correlation Summary
| Measurement | Barbadian | Immigrants from Denmark |
| Minimum | 0.47% | 0.58% |
| Maximum | 10.5% | 12.5% |
| Range | 10.0% | 12.0% |
| Mean | 3.2% | 4.0% |
| Median | 2.6% | 3.5% |
| Interquartile 25% (IQ1) | 2.2% | 2.9% |
| Interquartile 75% (IQ3) | 3.1% | 5.0% |
| Interquartile Range (IQR) | 0.91% | 2.1% |
| Standard Deviation (Sample) | 2.2% | 2.4% |
| Standard Deviation (Population) | 2.2% | 2.3% |
Similar Demographics by Hearing Disability
Demographics Similar to Barbadians by Hearing Disability
In terms of hearing disability, the demographic groups most similar to Barbadians are Immigrants from West Indies (2.5%, a difference of 0.15%), Ecuadorian (2.5%, a difference of 0.30%), Immigrants from India (2.5%, a difference of 0.47%), Sierra Leonean (2.5%, a difference of 0.62%), and Trinidadian and Tobagonian (2.5%, a difference of 0.85%).
| Demographics | Rating | Rank | Hearing Disability |
| British West Indians | 100.0 /100 | #8 | Exceptional 2.4% |
| Immigrants | Dominican Republic | 100.0 /100 | #9 | Exceptional 2.4% |
| Immigrants | Ecuador | 99.9 /100 | #10 | Exceptional 2.5% |
| Immigrants | Trinidad and Tobago | 99.9 /100 | #11 | Exceptional 2.5% |
| Trinidadians and Tobagonians | 99.9 /100 | #12 | Exceptional 2.5% |
| Sierra Leoneans | 99.9 /100 | #13 | Exceptional 2.5% |
| Ecuadorians | 99.9 /100 | #14 | Exceptional 2.5% |
| Barbadians | 99.9 /100 | #15 | Exceptional 2.5% |
| Immigrants | West Indies | 99.9 /100 | #16 | Exceptional 2.5% |
| Immigrants | India | 99.9 /100 | #17 | Exceptional 2.5% |
| Dominicans | 99.8 /100 | #18 | Exceptional 2.5% |
| Thais | 99.8 /100 | #19 | Exceptional 2.5% |
| Immigrants | Bolivia | 99.8 /100 | #20 | Exceptional 2.5% |
| Ghanaians | 99.8 /100 | #21 | Exceptional 2.5% |
| Immigrants | Sierra Leone | 99.8 /100 | #22 | Exceptional 2.6% |
Demographics Similar to Immigrants from Denmark by Hearing Disability
In terms of hearing disability, the demographic groups most similar to Immigrants from Denmark are Immigrants from Thailand (3.1%, a difference of 0.040%), Immigrants from Czechoslovakia (3.1%, a difference of 0.050%), Alsatian (3.1%, a difference of 0.050%), Eastern European (3.1%, a difference of 0.12%), and Hispanic or Latino (3.1%, a difference of 0.18%).
| Demographics | Rating | Rank | Hearing Disability |
| Immigrants | Europe | 22.9 /100 | #196 | Fair 3.1% |
| Immigrants | Bosnia and Herzegovina | 20.6 /100 | #197 | Fair 3.1% |
| Immigrants | Croatia | 20.5 /100 | #198 | Fair 3.1% |
| Syrians | 19.2 /100 | #199 | Poor 3.1% |
| Immigrants | North Macedonia | 19.1 /100 | #200 | Poor 3.1% |
| Iraqis | 19.0 /100 | #201 | Poor 3.1% |
| Immigrants | Thailand | 16.4 /100 | #202 | Poor 3.1% |
| Immigrants | Denmark | 16.2 /100 | #203 | Poor 3.1% |
| Immigrants | Czechoslovakia | 15.9 /100 | #204 | Poor 3.1% |
| Alsatians | 15.9 /100 | #205 | Poor 3.1% |
| Eastern Europeans | 15.5 /100 | #206 | Poor 3.1% |
| Hispanics or Latinos | 15.1 /100 | #207 | Poor 3.1% |
| Immigrants | Latvia | 12.7 /100 | #208 | Poor 3.1% |
| Immigrants | Hungary | 12.5 /100 | #209 | Poor 3.1% |
| Cape Verdeans | 12.2 /100 | #210 | Poor 3.1% |