Bangladeshi vs Tlingit-Haida Disability Age Over 75
COMPARE
Bangladeshi
Tlingit-Haida
Disability Age Over 75
Disability Age Over 75 Comparison
Bangladeshis
Tlingit-Haida
49.4%
DISABILITY AGE OVER 75
0.0/ 100
METRIC RATING
280th/ 347
METRIC RANK
50.6%
DISABILITY AGE OVER 75
0.0/ 100
METRIC RATING
310th/ 347
METRIC RANK
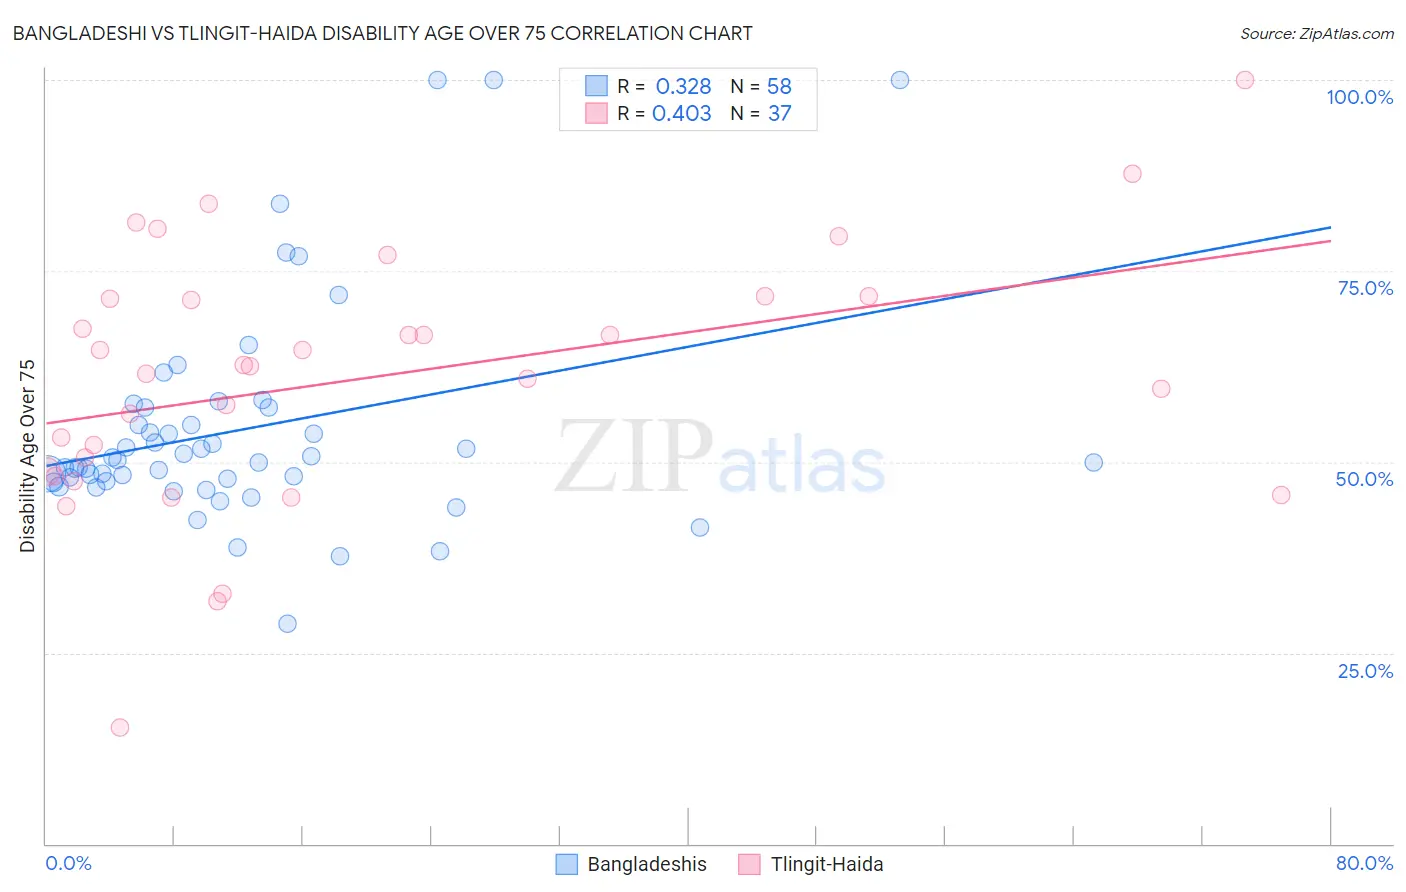
Bangladeshi vs Tlingit-Haida Disability Age Over 75 Correlation Chart
The statistical analysis conducted on geographies consisting of 141,101,779 people shows a mild positive correlation between the proportion of Bangladeshis and percentage of population with a disability over the age of 75 in the United States with a correlation coefficient (R) of 0.328 and weighted average of 49.4%. Similarly, the statistical analysis conducted on geographies consisting of 60,768,842 people shows a moderate positive correlation between the proportion of Tlingit-Haida and percentage of population with a disability over the age of 75 in the United States with a correlation coefficient (R) of 0.403 and weighted average of 50.6%, a difference of 2.4%.
Disability Age Over 75 Correlation Summary
| Measurement | Bangladeshi | Tlingit-Haida |
| Minimum | 28.8% | 15.2% |
| Maximum | 100.0% | 100.0% |
| Range | 71.2% | 84.8% |
| Mean | 54.2% | 60.9% |
| Median | 50.1% | 62.5% |
| Interquartile 25% (IQ1) | 47.4% | 48.4% |
| Interquartile 75% (IQ3) | 57.1% | 71.5% |
| Interquartile Range (IQR) | 9.7% | 23.0% |
| Standard Deviation (Sample) | 14.3% | 16.9% |
| Standard Deviation (Population) | 14.2% | 16.7% |
Similar Demographics by Disability Age Over 75
Demographics Similar to Bangladeshis by Disability Age Over 75
In terms of disability age over 75, the demographic groups most similar to Bangladeshis are Belizean (49.4%, a difference of 0.0%), Guamanian/Chamorro (49.4%, a difference of 0.060%), Black/African American (49.5%, a difference of 0.15%), Samoan (49.5%, a difference of 0.17%), and Immigrants from Latin America (49.5%, a difference of 0.23%).
| Demographics | Rating | Rank | Disability Age Over 75 |
| Immigrants | Iraq | 0.1 /100 | #273 | Tragic 49.1% |
| Immigrants | Guatemala | 0.1 /100 | #274 | Tragic 49.1% |
| Immigrants | Dominica | 0.1 /100 | #275 | Tragic 49.1% |
| Immigrants | Uzbekistan | 0.1 /100 | #276 | Tragic 49.2% |
| Hawaiians | 0.1 /100 | #277 | Tragic 49.2% |
| Immigrants | Laos | 0.1 /100 | #278 | Tragic 49.2% |
| Guamanians/Chamorros | 0.0 /100 | #279 | Tragic 49.4% |
| Bangladeshis | 0.0 /100 | #280 | Tragic 49.4% |
| Belizeans | 0.0 /100 | #281 | Tragic 49.4% |
| Blacks/African Americans | 0.0 /100 | #282 | Tragic 49.5% |
| Samoans | 0.0 /100 | #283 | Tragic 49.5% |
| Immigrants | Latin America | 0.0 /100 | #284 | Tragic 49.5% |
| Crow | 0.0 /100 | #285 | Tragic 49.6% |
| Immigrants | Belize | 0.0 /100 | #286 | Tragic 49.6% |
| Sioux | 0.0 /100 | #287 | Tragic 49.7% |
Demographics Similar to Tlingit-Haida by Disability Age Over 75
In terms of disability age over 75, the demographic groups most similar to Tlingit-Haida are Hispanic or Latino (50.6%, a difference of 0.040%), Aleut (50.6%, a difference of 0.040%), Immigrants from Fiji (50.6%, a difference of 0.070%), Cajun (50.7%, a difference of 0.10%), and Immigrants from Central America (50.5%, a difference of 0.12%).
| Demographics | Rating | Rank | Disability Age Over 75 |
| Japanese | 0.0 /100 | #303 | Tragic 50.2% |
| Immigrants | Dominican Republic | 0.0 /100 | #304 | Tragic 50.3% |
| Central American Indians | 0.0 /100 | #305 | Tragic 50.5% |
| Immigrants | Central America | 0.0 /100 | #306 | Tragic 50.5% |
| Immigrants | Fiji | 0.0 /100 | #307 | Tragic 50.6% |
| Hispanics or Latinos | 0.0 /100 | #308 | Tragic 50.6% |
| Aleuts | 0.0 /100 | #309 | Tragic 50.6% |
| Tlingit-Haida | 0.0 /100 | #310 | Tragic 50.6% |
| Cajuns | 0.0 /100 | #311 | Tragic 50.7% |
| Cheyenne | 0.0 /100 | #312 | Tragic 50.9% |
| Immigrants | Azores | 0.0 /100 | #313 | Tragic 50.9% |
| Immigrants | Mexico | 0.0 /100 | #314 | Tragic 51.1% |
| Mexicans | 0.0 /100 | #315 | Tragic 51.1% |
| Chickasaw | 0.0 /100 | #316 | Tragic 51.2% |
| Yakama | 0.0 /100 | #317 | Tragic 51.3% |