Bangladeshi vs Immigrants from Fiji Ambulatory Disability
COMPARE
Bangladeshi
Immigrants from Fiji
Ambulatory Disability
Ambulatory Disability Comparison
Bangladeshis
Immigrants from Fiji
6.3%
AMBULATORY DISABILITY
14.2/ 100
METRIC RATING
208th/ 347
METRIC RANK
6.0%
AMBULATORY DISABILITY
71.2/ 100
METRIC RATING
158th/ 347
METRIC RANK
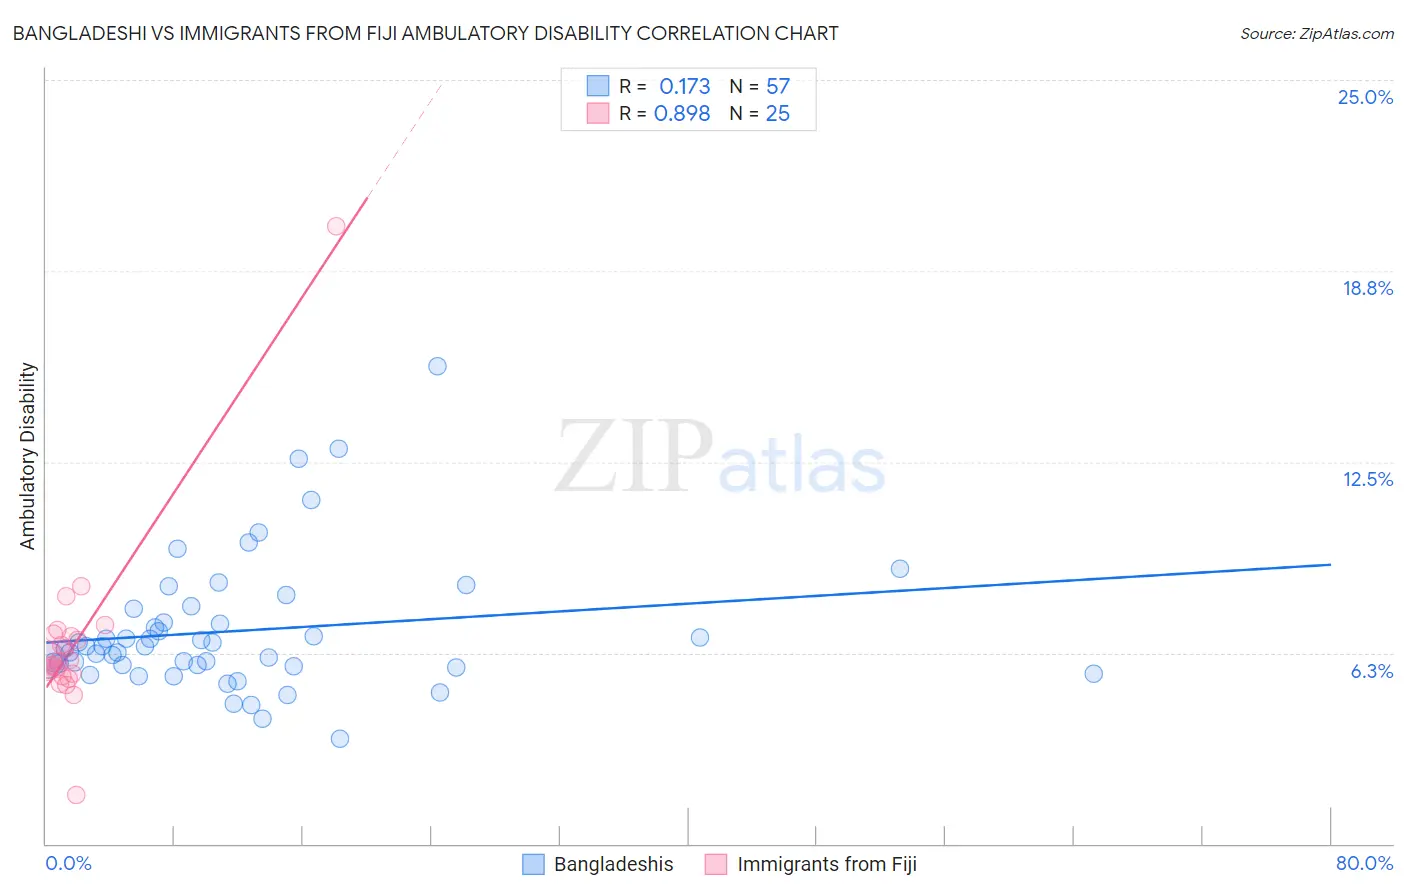
Bangladeshi vs Immigrants from Fiji Ambulatory Disability Correlation Chart
The statistical analysis conducted on geographies consisting of 141,368,014 people shows a poor positive correlation between the proportion of Bangladeshis and percentage of population with ambulatory disability in the United States with a correlation coefficient (R) of 0.173 and weighted average of 6.3%. Similarly, the statistical analysis conducted on geographies consisting of 93,755,380 people shows a very strong positive correlation between the proportion of Immigrants from Fiji and percentage of population with ambulatory disability in the United States with a correlation coefficient (R) of 0.898 and weighted average of 6.0%, a difference of 3.6%.
Ambulatory Disability Correlation Summary
| Measurement | Bangladeshi | Immigrants from Fiji |
| Minimum | 3.4% | 1.6% |
| Maximum | 15.6% | 20.2% |
| Range | 12.2% | 18.6% |
| Mean | 7.0% | 6.6% |
| Median | 6.5% | 6.0% |
| Interquartile 25% (IQ1) | 5.8% | 5.5% |
| Interquartile 75% (IQ3) | 7.5% | 6.8% |
| Interquartile Range (IQR) | 1.6% | 1.3% |
| Standard Deviation (Sample) | 2.2% | 3.1% |
| Standard Deviation (Population) | 2.2% | 3.0% |
Similar Demographics by Ambulatory Disability
Demographics Similar to Bangladeshis by Ambulatory Disability
In terms of ambulatory disability, the demographic groups most similar to Bangladeshis are Immigrants from Iraq (6.3%, a difference of 0.020%), Alsatian (6.3%, a difference of 0.090%), Immigrants from Laos (6.3%, a difference of 0.10%), Samoan (6.3%, a difference of 0.24%), and Mexican American Indian (6.3%, a difference of 0.25%).
| Demographics | Rating | Rank | Ambulatory Disability |
| Immigrants | Central America | 20.1 /100 | #201 | Fair 6.2% |
| Albanians | 19.7 /100 | #202 | Poor 6.2% |
| Immigrants | Ukraine | 18.4 /100 | #203 | Poor 6.2% |
| Immigrants | Congo | 18.2 /100 | #204 | Poor 6.2% |
| Slovenes | 18.0 /100 | #205 | Poor 6.2% |
| Finns | 17.2 /100 | #206 | Poor 6.2% |
| Alsatians | 15.1 /100 | #207 | Poor 6.3% |
| Bangladeshis | 14.2 /100 | #208 | Poor 6.3% |
| Immigrants | Iraq | 14.0 /100 | #209 | Poor 6.3% |
| Immigrants | Laos | 13.2 /100 | #210 | Poor 6.3% |
| Samoans | 12.1 /100 | #211 | Poor 6.3% |
| Mexican American Indians | 12.0 /100 | #212 | Poor 6.3% |
| Japanese | 12.0 /100 | #213 | Poor 6.3% |
| Immigrants | Mexico | 11.0 /100 | #214 | Poor 6.3% |
| Immigrants | Latin America | 11.0 /100 | #215 | Poor 6.3% |
Demographics Similar to Immigrants from Fiji by Ambulatory Disability
In terms of ambulatory disability, the demographic groups most similar to Immigrants from Fiji are Ghanaian (6.0%, a difference of 0.010%), Immigrants from Latvia (6.0%, a difference of 0.010%), Northern European (6.0%, a difference of 0.050%), Immigrants from Scotland (6.0%, a difference of 0.070%), and Central American (6.0%, a difference of 0.080%).
| Demographics | Rating | Rank | Ambulatory Disability |
| Greeks | 79.6 /100 | #151 | Good 6.0% |
| Immigrants | Austria | 78.8 /100 | #152 | Good 6.0% |
| Syrians | 75.5 /100 | #153 | Good 6.0% |
| Immigrants | Croatia | 75.1 /100 | #154 | Good 6.0% |
| Immigrants | Scotland | 72.1 /100 | #155 | Good 6.0% |
| Northern Europeans | 71.8 /100 | #156 | Good 6.0% |
| Ghanaians | 71.3 /100 | #157 | Good 6.0% |
| Immigrants | Fiji | 71.2 /100 | #158 | Good 6.0% |
| Immigrants | Latvia | 71.1 /100 | #159 | Good 6.0% |
| Central Americans | 69.8 /100 | #160 | Good 6.0% |
| Immigrants | Belarus | 69.2 /100 | #161 | Good 6.1% |
| Nigerians | 67.1 /100 | #162 | Good 6.1% |
| Lebanese | 66.2 /100 | #163 | Good 6.1% |
| Basques | 63.7 /100 | #164 | Good 6.1% |
| Nicaraguans | 63.2 /100 | #165 | Good 6.1% |