Bangladeshi vs Immigrants from Cameroon Ambulatory Disability
COMPARE
Bangladeshi
Immigrants from Cameroon
Ambulatory Disability
Ambulatory Disability Comparison
Bangladeshis
Immigrants from Cameroon
6.3%
AMBULATORY DISABILITY
14.2/ 100
METRIC RATING
208th/ 347
METRIC RANK
5.7%
AMBULATORY DISABILITY
99.4/ 100
METRIC RATING
74th/ 347
METRIC RANK
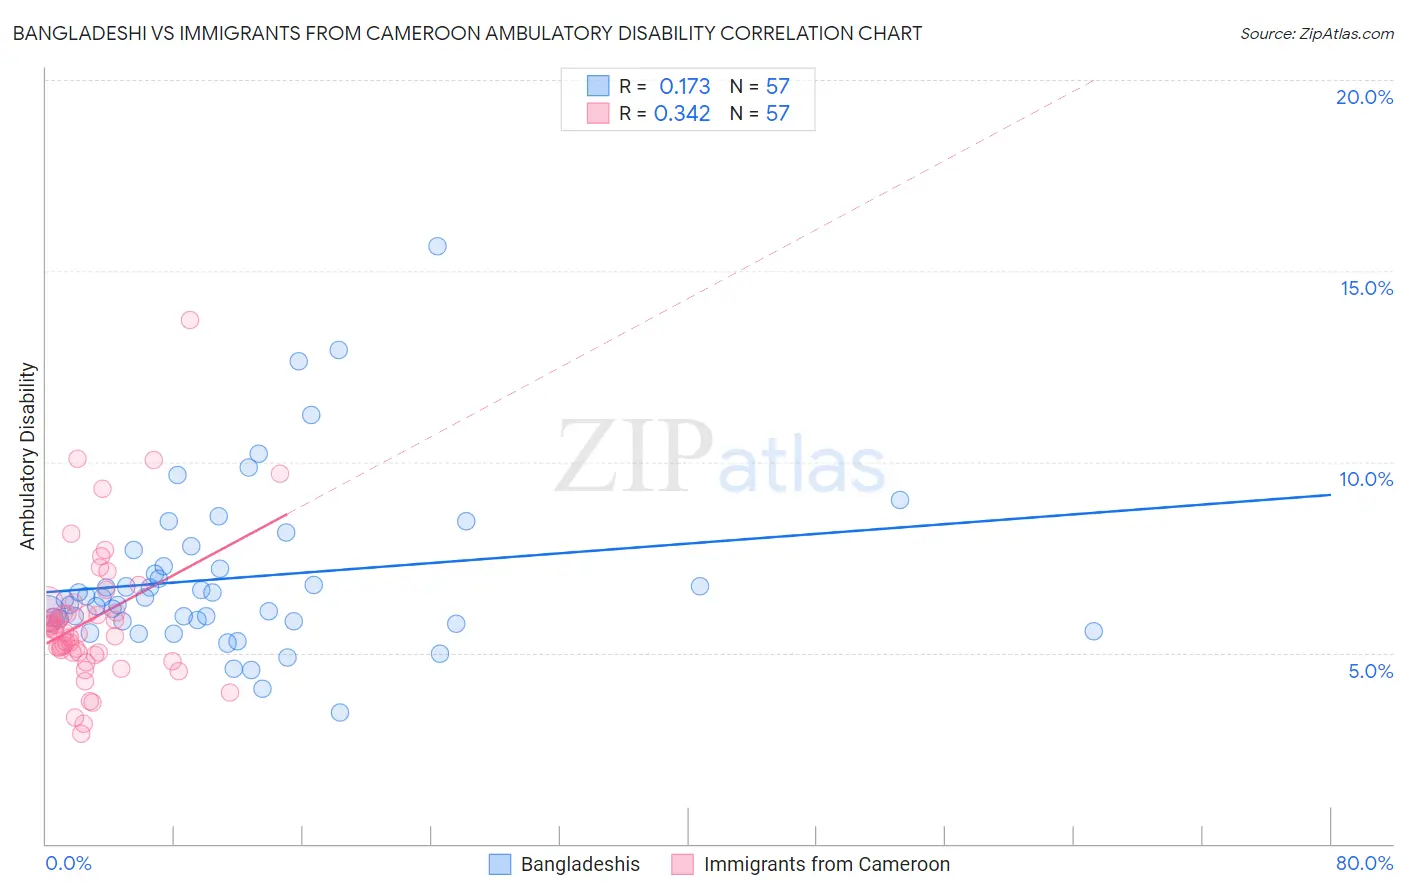
Bangladeshi vs Immigrants from Cameroon Ambulatory Disability Correlation Chart
The statistical analysis conducted on geographies consisting of 141,368,014 people shows a poor positive correlation between the proportion of Bangladeshis and percentage of population with ambulatory disability in the United States with a correlation coefficient (R) of 0.173 and weighted average of 6.3%. Similarly, the statistical analysis conducted on geographies consisting of 130,739,199 people shows a mild positive correlation between the proportion of Immigrants from Cameroon and percentage of population with ambulatory disability in the United States with a correlation coefficient (R) of 0.342 and weighted average of 5.7%, a difference of 9.8%.
Ambulatory Disability Correlation Summary
| Measurement | Bangladeshi | Immigrants from Cameroon |
| Minimum | 3.4% | 2.9% |
| Maximum | 15.6% | 13.7% |
| Range | 12.2% | 10.8% |
| Mean | 7.0% | 5.9% |
| Median | 6.5% | 5.6% |
| Interquartile 25% (IQ1) | 5.8% | 5.0% |
| Interquartile 75% (IQ3) | 7.5% | 6.2% |
| Interquartile Range (IQR) | 1.6% | 1.2% |
| Standard Deviation (Sample) | 2.2% | 1.9% |
| Standard Deviation (Population) | 2.2% | 1.8% |
Similar Demographics by Ambulatory Disability
Demographics Similar to Bangladeshis by Ambulatory Disability
In terms of ambulatory disability, the demographic groups most similar to Bangladeshis are Immigrants from Iraq (6.3%, a difference of 0.020%), Alsatian (6.3%, a difference of 0.090%), Immigrants from Laos (6.3%, a difference of 0.10%), Samoan (6.3%, a difference of 0.24%), and Mexican American Indian (6.3%, a difference of 0.25%).
| Demographics | Rating | Rank | Ambulatory Disability |
| Immigrants | Central America | 20.1 /100 | #201 | Fair 6.2% |
| Albanians | 19.7 /100 | #202 | Poor 6.2% |
| Immigrants | Ukraine | 18.4 /100 | #203 | Poor 6.2% |
| Immigrants | Congo | 18.2 /100 | #204 | Poor 6.2% |
| Slovenes | 18.0 /100 | #205 | Poor 6.2% |
| Finns | 17.2 /100 | #206 | Poor 6.2% |
| Alsatians | 15.1 /100 | #207 | Poor 6.3% |
| Bangladeshis | 14.2 /100 | #208 | Poor 6.3% |
| Immigrants | Iraq | 14.0 /100 | #209 | Poor 6.3% |
| Immigrants | Laos | 13.2 /100 | #210 | Poor 6.3% |
| Samoans | 12.1 /100 | #211 | Poor 6.3% |
| Mexican American Indians | 12.0 /100 | #212 | Poor 6.3% |
| Japanese | 12.0 /100 | #213 | Poor 6.3% |
| Immigrants | Mexico | 11.0 /100 | #214 | Poor 6.3% |
| Immigrants | Latin America | 11.0 /100 | #215 | Poor 6.3% |
Demographics Similar to Immigrants from Cameroon by Ambulatory Disability
In terms of ambulatory disability, the demographic groups most similar to Immigrants from Cameroon are Immigrants from Northern Africa (5.7%, a difference of 0.010%), Brazilian (5.7%, a difference of 0.020%), Immigrants from Peru (5.7%, a difference of 0.040%), Immigrants from South Africa (5.7%, a difference of 0.050%), and Sudanese (5.7%, a difference of 0.070%).
| Demographics | Rating | Rank | Ambulatory Disability |
| Immigrants | Uganda | 99.6 /100 | #67 | Exceptional 5.7% |
| Sri Lankans | 99.6 /100 | #68 | Exceptional 5.7% |
| Peruvians | 99.5 /100 | #69 | Exceptional 5.7% |
| Sierra Leoneans | 99.4 /100 | #70 | Exceptional 5.7% |
| Immigrants | Peru | 99.4 /100 | #71 | Exceptional 5.7% |
| Brazilians | 99.4 /100 | #72 | Exceptional 5.7% |
| Immigrants | Northern Africa | 99.4 /100 | #73 | Exceptional 5.7% |
| Immigrants | Cameroon | 99.4 /100 | #74 | Exceptional 5.7% |
| Immigrants | South Africa | 99.3 /100 | #75 | Exceptional 5.7% |
| Sudanese | 99.3 /100 | #76 | Exceptional 5.7% |
| Immigrants | Vietnam | 99.3 /100 | #77 | Exceptional 5.7% |
| Somalis | 99.2 /100 | #78 | Exceptional 5.7% |
| Chileans | 99.2 /100 | #79 | Exceptional 5.7% |
| Immigrants | Ireland | 99.2 /100 | #80 | Exceptional 5.7% |
| Immigrants | Jordan | 99.2 /100 | #81 | Exceptional 5.7% |