Bangladeshi vs Delaware Hearing Disability
COMPARE
Bangladeshi
Delaware
Hearing Disability
Hearing Disability Comparison
Bangladeshis
Delaware
3.2%
HEARING DISABILITY
8.1/ 100
METRIC RATING
215th/ 347
METRIC RANK
3.6%
HEARING DISABILITY
0.0/ 100
METRIC RATING
286th/ 347
METRIC RANK
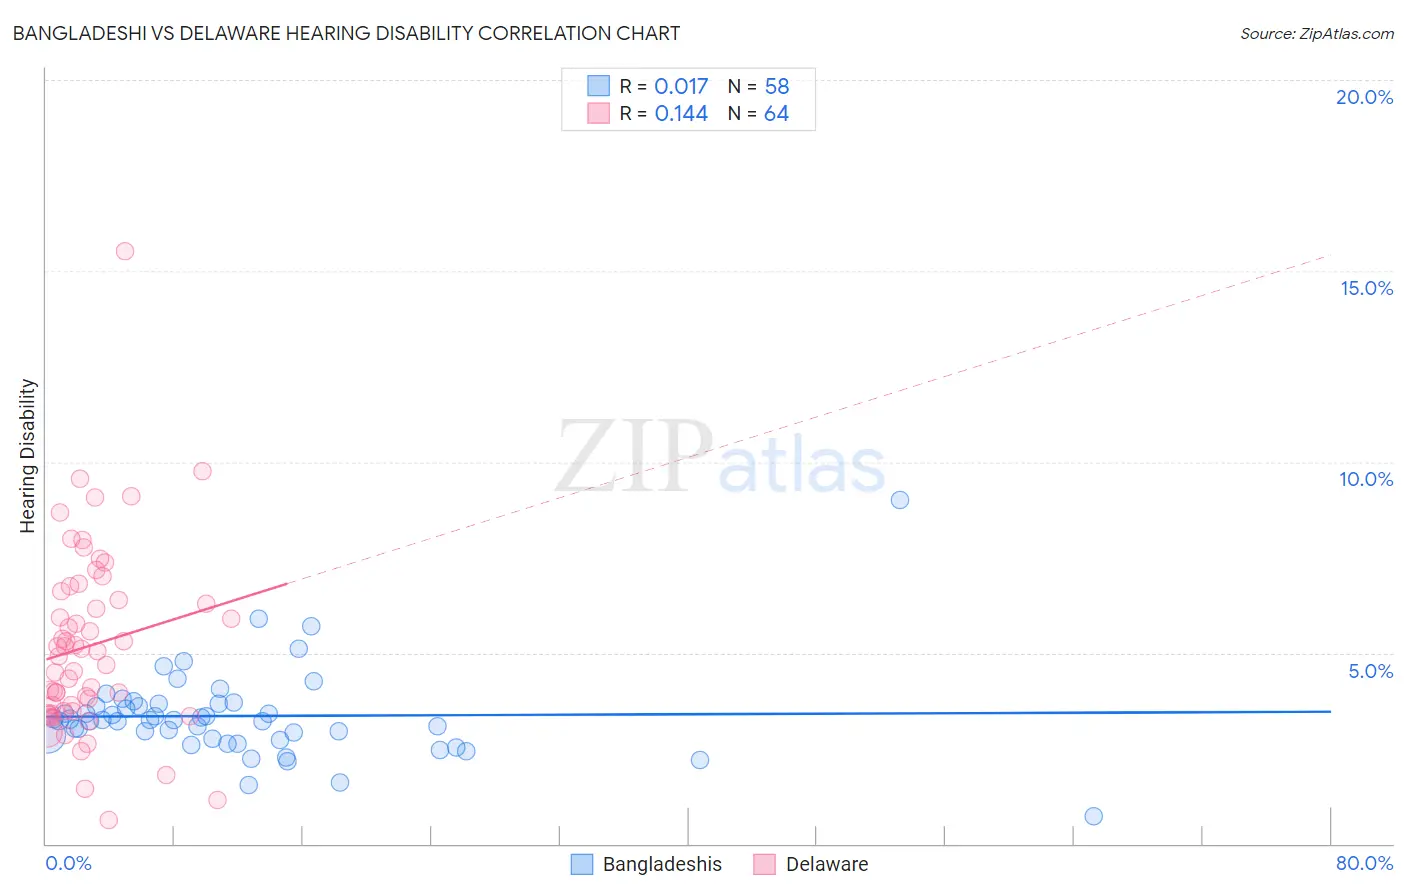
Bangladeshi vs Delaware Hearing Disability Correlation Chart
The statistical analysis conducted on geographies consisting of 141,366,446 people shows no correlation between the proportion of Bangladeshis and percentage of population with hearing disability in the United States with a correlation coefficient (R) of 0.017 and weighted average of 3.2%. Similarly, the statistical analysis conducted on geographies consisting of 96,230,255 people shows a poor positive correlation between the proportion of Delaware and percentage of population with hearing disability in the United States with a correlation coefficient (R) of 0.144 and weighted average of 3.6%, a difference of 15.0%.
Hearing Disability Correlation Summary
| Measurement | Bangladeshi | Delaware |
| Minimum | 0.71% | 0.61% |
| Maximum | 9.0% | 15.5% |
| Range | 8.3% | 14.9% |
| Mean | 3.3% | 5.2% |
| Median | 3.2% | 5.0% |
| Interquartile 25% (IQ1) | 2.8% | 3.5% |
| Interquartile 75% (IQ3) | 3.7% | 6.5% |
| Interquartile Range (IQR) | 0.90% | 3.0% |
| Standard Deviation (Sample) | 1.2% | 2.4% |
| Standard Deviation (Population) | 1.2% | 2.4% |
Similar Demographics by Hearing Disability
Demographics Similar to Bangladeshis by Hearing Disability
In terms of hearing disability, the demographic groups most similar to Bangladeshis are Australian (3.2%, a difference of 0.010%), Immigrants from Norway (3.2%, a difference of 0.24%), Russian (3.2%, a difference of 0.32%), Immigrants from Northern Europe (3.2%, a difference of 0.35%), and New Zealander (3.2%, a difference of 0.41%).
| Demographics | Rating | Rank | Hearing Disability |
| Immigrants | Latvia | 12.7 /100 | #208 | Poor 3.1% |
| Immigrants | Hungary | 12.5 /100 | #209 | Poor 3.1% |
| Cape Verdeans | 12.2 /100 | #210 | Poor 3.1% |
| Romanians | 12.1 /100 | #211 | Poor 3.1% |
| Pakistanis | 11.1 /100 | #212 | Poor 3.1% |
| Immigrants | Iraq | 10.5 /100 | #213 | Poor 3.1% |
| Australians | 8.1 /100 | #214 | Tragic 3.2% |
| Bangladeshis | 8.1 /100 | #215 | Tragic 3.2% |
| Immigrants | Norway | 7.3 /100 | #216 | Tragic 3.2% |
| Russians | 7.1 /100 | #217 | Tragic 3.2% |
| Immigrants | Northern Europe | 7.0 /100 | #218 | Tragic 3.2% |
| New Zealanders | 6.8 /100 | #219 | Tragic 3.2% |
| Malaysians | 6.6 /100 | #220 | Tragic 3.2% |
| Immigrants | Laos | 6.6 /100 | #221 | Tragic 3.2% |
| Immigrants | Oceania | 6.5 /100 | #222 | Tragic 3.2% |
Demographics Similar to Delaware by Hearing Disability
In terms of hearing disability, the demographic groups most similar to Delaware are Sioux (3.6%, a difference of 0.030%), Immigrants from Micronesia (3.6%, a difference of 0.13%), Spanish (3.7%, a difference of 0.24%), Blackfeet (3.6%, a difference of 0.60%), and Irish (3.7%, a difference of 0.82%).
| Demographics | Rating | Rank | Hearing Disability |
| Slovaks | 0.0 /100 | #279 | Tragic 3.6% |
| French American Indians | 0.0 /100 | #280 | Tragic 3.6% |
| Scandinavians | 0.0 /100 | #281 | Tragic 3.6% |
| Swedes | 0.0 /100 | #282 | Tragic 3.6% |
| Blackfeet | 0.0 /100 | #283 | Tragic 3.6% |
| Immigrants | Micronesia | 0.0 /100 | #284 | Tragic 3.6% |
| Sioux | 0.0 /100 | #285 | Tragic 3.6% |
| Delaware | 0.0 /100 | #286 | Tragic 3.6% |
| Spanish | 0.0 /100 | #287 | Tragic 3.7% |
| Irish | 0.0 /100 | #288 | Tragic 3.7% |
| Chinese | 0.0 /100 | #289 | Tragic 3.7% |
| Whites/Caucasians | 0.0 /100 | #290 | Tragic 3.7% |
| Finns | 0.0 /100 | #291 | Tragic 3.7% |
| Native Hawaiians | 0.0 /100 | #292 | Tragic 3.7% |
| Norwegians | 0.0 /100 | #293 | Tragic 3.7% |