Immigrants from Switzerland vs Delaware Hearing Disability
COMPARE
Immigrants from Switzerland
Delaware
Hearing Disability
Hearing Disability Comparison
Immigrants from Switzerland
Delaware
3.1%
HEARING DISABILITY
28.8/ 100
METRIC RATING
191st/ 347
METRIC RANK
3.6%
HEARING DISABILITY
0.0/ 100
METRIC RATING
286th/ 347
METRIC RANK
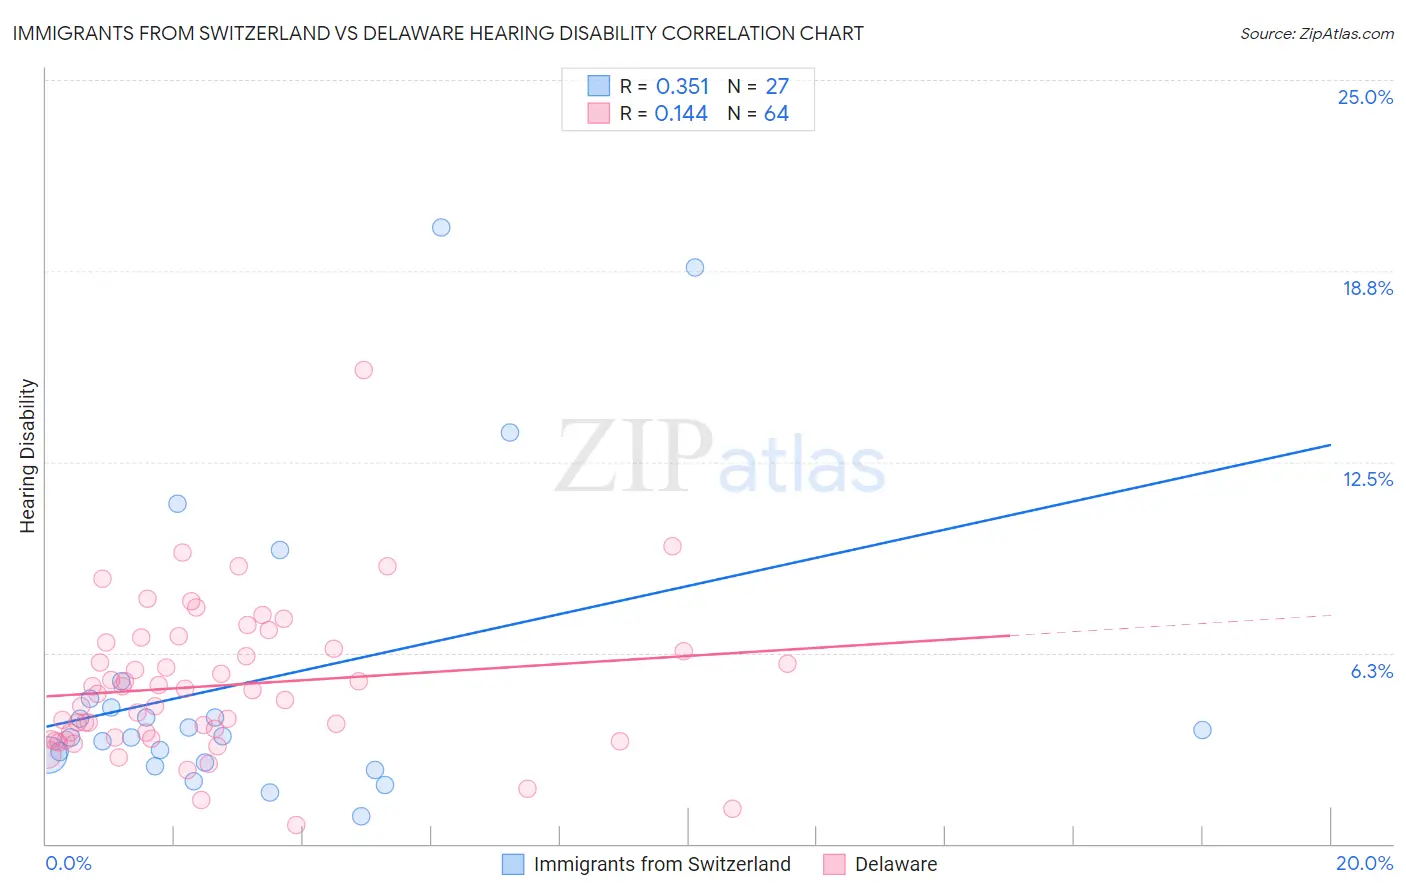
Immigrants from Switzerland vs Delaware Hearing Disability Correlation Chart
The statistical analysis conducted on geographies consisting of 148,077,684 people shows a mild positive correlation between the proportion of Immigrants from Switzerland and percentage of population with hearing disability in the United States with a correlation coefficient (R) of 0.351 and weighted average of 3.1%. Similarly, the statistical analysis conducted on geographies consisting of 96,230,255 people shows a poor positive correlation between the proportion of Delaware and percentage of population with hearing disability in the United States with a correlation coefficient (R) of 0.144 and weighted average of 3.6%, a difference of 19.1%.
Hearing Disability Correlation Summary
| Measurement | Immigrants from Switzerland | Delaware |
| Minimum | 0.89% | 0.61% |
| Maximum | 20.2% | 15.5% |
| Range | 19.3% | 14.9% |
| Mean | 5.4% | 5.2% |
| Median | 3.5% | 5.0% |
| Interquartile 25% (IQ1) | 2.7% | 3.5% |
| Interquartile 75% (IQ3) | 4.7% | 6.5% |
| Interquartile Range (IQR) | 2.1% | 3.0% |
| Standard Deviation (Sample) | 5.0% | 2.4% |
| Standard Deviation (Population) | 4.9% | 2.4% |
Similar Demographics by Hearing Disability
Demographics Similar to Immigrants from Switzerland by Hearing Disability
In terms of hearing disability, the demographic groups most similar to Immigrants from Switzerland are Korean (3.1%, a difference of 0.13%), Macedonian (3.1%, a difference of 0.21%), Immigrants from South Africa (3.1%, a difference of 0.25%), African (3.0%, a difference of 0.44%), and South African (3.1%, a difference of 0.51%).
| Demographics | Rating | Rank | Hearing Disability |
| Immigrants | Ireland | 37.4 /100 | #184 | Fair 3.0% |
| Immigrants | Southern Europe | 35.3 /100 | #185 | Fair 3.0% |
| Immigrants | Mexico | 34.9 /100 | #186 | Fair 3.0% |
| Blacks/African Americans | 34.7 /100 | #187 | Fair 3.0% |
| Mexican American Indians | 34.7 /100 | #188 | Fair 3.0% |
| Africans | 32.9 /100 | #189 | Fair 3.0% |
| Immigrants | South Africa | 31.1 /100 | #190 | Fair 3.1% |
| Immigrants | Switzerland | 28.8 /100 | #191 | Fair 3.1% |
| Koreans | 27.6 /100 | #192 | Fair 3.1% |
| Macedonians | 27.0 /100 | #193 | Fair 3.1% |
| South Africans | 24.5 /100 | #194 | Fair 3.1% |
| Spanish American Indians | 24.1 /100 | #195 | Fair 3.1% |
| Immigrants | Europe | 22.9 /100 | #196 | Fair 3.1% |
| Immigrants | Bosnia and Herzegovina | 20.6 /100 | #197 | Fair 3.1% |
| Immigrants | Croatia | 20.5 /100 | #198 | Fair 3.1% |
Demographics Similar to Delaware by Hearing Disability
In terms of hearing disability, the demographic groups most similar to Delaware are Sioux (3.6%, a difference of 0.030%), Immigrants from Micronesia (3.6%, a difference of 0.13%), Spanish (3.7%, a difference of 0.24%), Blackfeet (3.6%, a difference of 0.60%), and Irish (3.7%, a difference of 0.82%).
| Demographics | Rating | Rank | Hearing Disability |
| Slovaks | 0.0 /100 | #279 | Tragic 3.6% |
| French American Indians | 0.0 /100 | #280 | Tragic 3.6% |
| Scandinavians | 0.0 /100 | #281 | Tragic 3.6% |
| Swedes | 0.0 /100 | #282 | Tragic 3.6% |
| Blackfeet | 0.0 /100 | #283 | Tragic 3.6% |
| Immigrants | Micronesia | 0.0 /100 | #284 | Tragic 3.6% |
| Sioux | 0.0 /100 | #285 | Tragic 3.6% |
| Delaware | 0.0 /100 | #286 | Tragic 3.6% |
| Spanish | 0.0 /100 | #287 | Tragic 3.7% |
| Irish | 0.0 /100 | #288 | Tragic 3.7% |
| Chinese | 0.0 /100 | #289 | Tragic 3.7% |
| Whites/Caucasians | 0.0 /100 | #290 | Tragic 3.7% |
| Finns | 0.0 /100 | #291 | Tragic 3.7% |
| Native Hawaiians | 0.0 /100 | #292 | Tragic 3.7% |
| Norwegians | 0.0 /100 | #293 | Tragic 3.7% |