Luxembourger vs Delaware Hearing Disability
COMPARE
Luxembourger
Delaware
Hearing Disability
Hearing Disability Comparison
Luxembourgers
Delaware
3.2%
HEARING DISABILITY
2.9/ 100
METRIC RATING
231st/ 347
METRIC RANK
3.6%
HEARING DISABILITY
0.0/ 100
METRIC RATING
286th/ 347
METRIC RANK
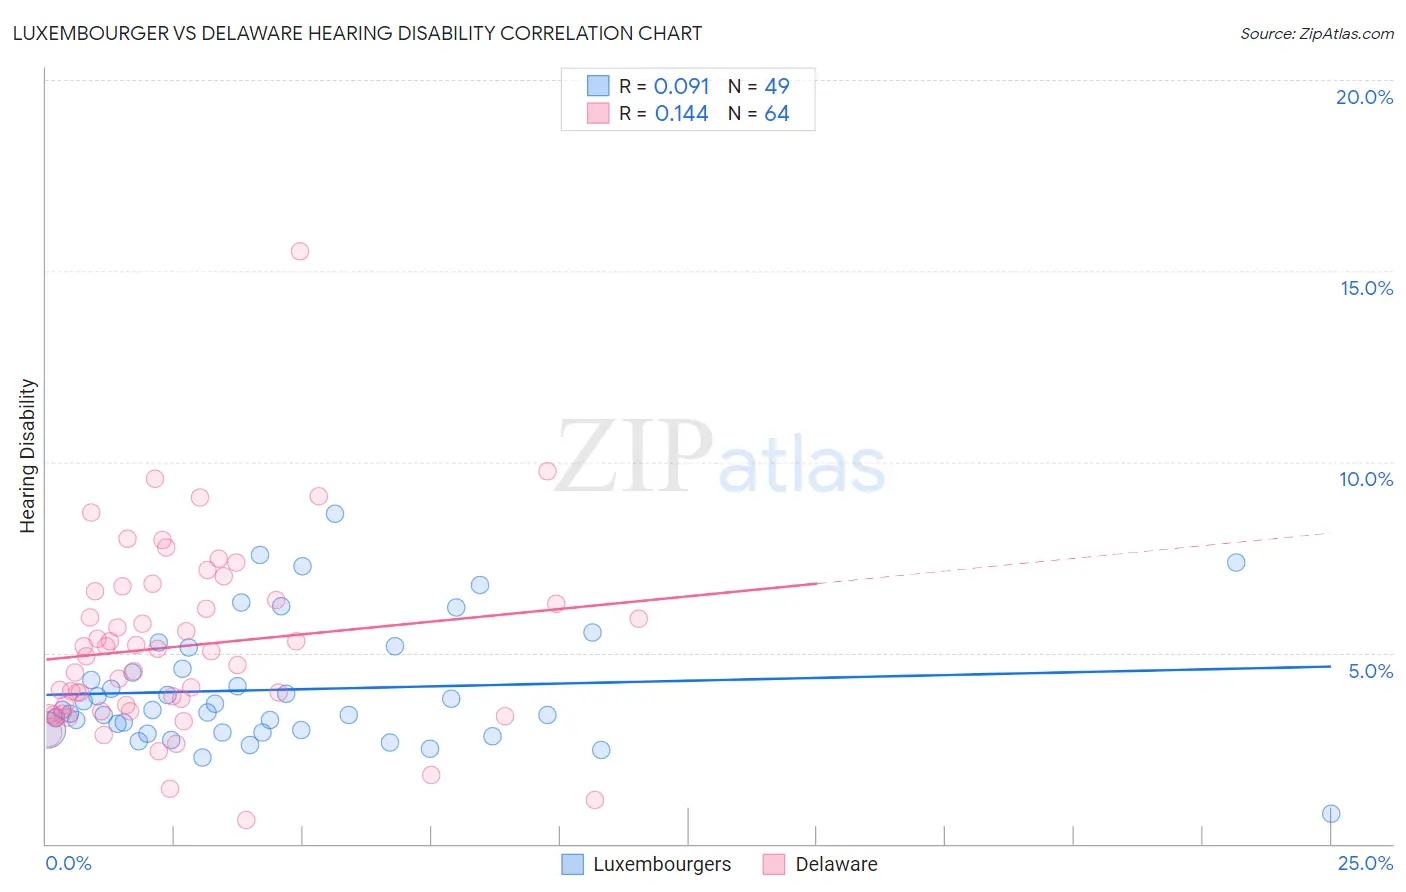
Luxembourger vs Delaware Hearing Disability Correlation Chart
The statistical analysis conducted on geographies consisting of 144,678,787 people shows a slight positive correlation between the proportion of Luxembourgers and percentage of population with hearing disability in the United States with a correlation coefficient (R) of 0.091 and weighted average of 3.2%. Similarly, the statistical analysis conducted on geographies consisting of 96,230,255 people shows a poor positive correlation between the proportion of Delaware and percentage of population with hearing disability in the United States with a correlation coefficient (R) of 0.144 and weighted average of 3.6%, a difference of 12.4%.
Hearing Disability Correlation Summary
| Measurement | Luxembourger | Delaware |
| Minimum | 0.78% | 0.61% |
| Maximum | 8.6% | 15.5% |
| Range | 7.9% | 14.9% |
| Mean | 4.0% | 5.2% |
| Median | 3.5% | 5.0% |
| Interquartile 25% (IQ1) | 2.9% | 3.5% |
| Interquartile 75% (IQ3) | 4.9% | 6.5% |
| Interquartile Range (IQR) | 1.9% | 3.0% |
| Standard Deviation (Sample) | 1.6% | 2.4% |
| Standard Deviation (Population) | 1.6% | 2.4% |
Similar Demographics by Hearing Disability
Demographics Similar to Luxembourgers by Hearing Disability
In terms of hearing disability, the demographic groups most similar to Luxembourgers are Ukrainian (3.2%, a difference of 0.050%), Greek (3.2%, a difference of 0.23%), Estonian (3.3%, a difference of 0.42%), Central American Indian (3.3%, a difference of 0.49%), and Guamanian/Chamorro (3.3%, a difference of 0.60%).
| Demographics | Rating | Rank | Hearing Disability |
| Icelanders | 5.2 /100 | #224 | Tragic 3.2% |
| Latvians | 5.1 /100 | #225 | Tragic 3.2% |
| Lebanese | 5.0 /100 | #226 | Tragic 3.2% |
| Bhutanese | 4.6 /100 | #227 | Tragic 3.2% |
| Immigrants | Portugal | 4.3 /100 | #228 | Tragic 3.2% |
| Maltese | 4.1 /100 | #229 | Tragic 3.2% |
| Greeks | 3.2 /100 | #230 | Tragic 3.2% |
| Luxembourgers | 2.9 /100 | #231 | Tragic 3.2% |
| Ukrainians | 2.9 /100 | #232 | Tragic 3.2% |
| Estonians | 2.4 /100 | #233 | Tragic 3.3% |
| Central American Indians | 2.3 /100 | #234 | Tragic 3.3% |
| Guamanians/Chamorros | 2.2 /100 | #235 | Tragic 3.3% |
| Serbians | 2.2 /100 | #236 | Tragic 3.3% |
| Immigrants | Austria | 1.8 /100 | #237 | Tragic 3.3% |
| German Russians | 1.8 /100 | #238 | Tragic 3.3% |
Demographics Similar to Delaware by Hearing Disability
In terms of hearing disability, the demographic groups most similar to Delaware are Sioux (3.6%, a difference of 0.030%), Immigrants from Micronesia (3.6%, a difference of 0.13%), Spanish (3.7%, a difference of 0.24%), Blackfeet (3.6%, a difference of 0.60%), and Irish (3.7%, a difference of 0.82%).
| Demographics | Rating | Rank | Hearing Disability |
| Slovaks | 0.0 /100 | #279 | Tragic 3.6% |
| French American Indians | 0.0 /100 | #280 | Tragic 3.6% |
| Scandinavians | 0.0 /100 | #281 | Tragic 3.6% |
| Swedes | 0.0 /100 | #282 | Tragic 3.6% |
| Blackfeet | 0.0 /100 | #283 | Tragic 3.6% |
| Immigrants | Micronesia | 0.0 /100 | #284 | Tragic 3.6% |
| Sioux | 0.0 /100 | #285 | Tragic 3.6% |
| Delaware | 0.0 /100 | #286 | Tragic 3.6% |
| Spanish | 0.0 /100 | #287 | Tragic 3.7% |
| Irish | 0.0 /100 | #288 | Tragic 3.7% |
| Chinese | 0.0 /100 | #289 | Tragic 3.7% |
| Whites/Caucasians | 0.0 /100 | #290 | Tragic 3.7% |
| Finns | 0.0 /100 | #291 | Tragic 3.7% |
| Native Hawaiians | 0.0 /100 | #292 | Tragic 3.7% |
| Norwegians | 0.0 /100 | #293 | Tragic 3.7% |