Bangladeshi vs Delaware Disability Age 65 to 74
COMPARE
Bangladeshi
Delaware
Disability Age 65 to 74
Disability Age 65 to 74 Comparison
Bangladeshis
Delaware
26.8%
DISABILITY AGE 65 TO 74
0.0/ 100
METRIC RATING
296th/ 347
METRIC RANK
25.9%
DISABILITY AGE 65 TO 74
0.1/ 100
METRIC RATING
282nd/ 347
METRIC RANK
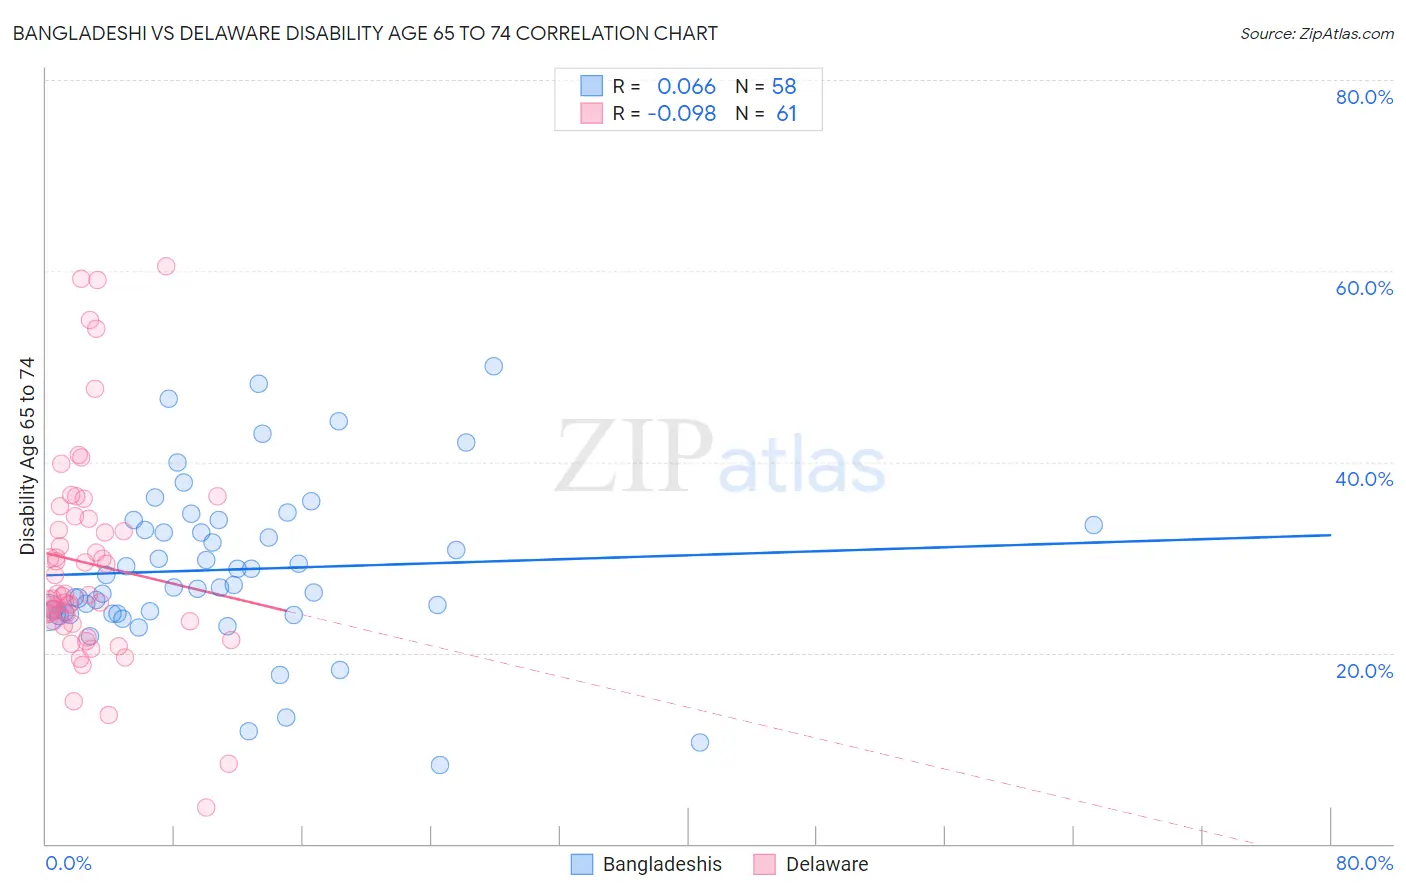
Bangladeshi vs Delaware Disability Age 65 to 74 Correlation Chart
The statistical analysis conducted on geographies consisting of 141,045,200 people shows a slight positive correlation between the proportion of Bangladeshis and percentage of population with a disability between the ages 65 and 75 in the United States with a correlation coefficient (R) of 0.066 and weighted average of 26.8%. Similarly, the statistical analysis conducted on geographies consisting of 96,201,129 people shows a slight negative correlation between the proportion of Delaware and percentage of population with a disability between the ages 65 and 75 in the United States with a correlation coefficient (R) of -0.098 and weighted average of 25.9%, a difference of 3.6%.
Disability Age 65 to 74 Correlation Summary
| Measurement | Bangladeshi | Delaware |
| Minimum | 8.3% | 3.8% |
| Maximum | 50.0% | 60.5% |
| Range | 41.7% | 56.6% |
| Mean | 28.7% | 29.3% |
| Median | 27.0% | 26.1% |
| Interquartile 25% (IQ1) | 24.1% | 23.2% |
| Interquartile 75% (IQ3) | 33.3% | 34.2% |
| Interquartile Range (IQR) | 9.2% | 11.0% |
| Standard Deviation (Sample) | 8.6% | 11.4% |
| Standard Deviation (Population) | 8.5% | 11.3% |
Demographics Similar to Bangladeshis and Delaware by Disability Age 65 to 74
In terms of disability age 65 to 74, the demographic groups most similar to Bangladeshis are Fijian (27.0%, a difference of 0.59%), Hispanic or Latino (26.7%, a difference of 0.61%), Immigrants from Yemen (27.0%, a difference of 0.61%), Dominican (26.7%, a difference of 0.63%), and Potawatomi (27.0%, a difference of 0.64%). Similarly, the demographic groups most similar to Delaware are Immigrants from Honduras (25.9%, a difference of 0.070%), Cree (25.9%, a difference of 0.090%), Spanish American (25.9%, a difference of 0.14%), U.S. Virgin Islander (25.9%, a difference of 0.18%), and Immigrants from the Azores (26.0%, a difference of 0.33%).
| Demographics | Rating | Rank | Disability Age 65 to 74 |
| U.S. Virgin Islanders | 0.1 /100 | #279 | Tragic 25.9% |
| Cree | 0.1 /100 | #280 | Tragic 25.9% |
| Immigrants | Honduras | 0.1 /100 | #281 | Tragic 25.9% |
| Delaware | 0.1 /100 | #282 | Tragic 25.9% |
| Spanish Americans | 0.0 /100 | #283 | Tragic 25.9% |
| Immigrants | Azores | 0.0 /100 | #284 | Tragic 26.0% |
| Immigrants | Congo | 0.0 /100 | #285 | Tragic 26.0% |
| Immigrants | Micronesia | 0.0 /100 | #286 | Tragic 26.1% |
| Immigrants | Laos | 0.0 /100 | #287 | Tragic 26.1% |
| Mexican American Indians | 0.0 /100 | #288 | Tragic 26.2% |
| Africans | 0.0 /100 | #289 | Tragic 26.2% |
| Immigrants | Cabo Verde | 0.0 /100 | #290 | Tragic 26.3% |
| Spanish American Indians | 0.0 /100 | #291 | Tragic 26.4% |
| Blackfeet | 0.0 /100 | #292 | Tragic 26.6% |
| Immigrants | Central America | 0.0 /100 | #293 | Tragic 26.6% |
| Dominicans | 0.0 /100 | #294 | Tragic 26.7% |
| Hispanics or Latinos | 0.0 /100 | #295 | Tragic 26.7% |
| Bangladeshis | 0.0 /100 | #296 | Tragic 26.8% |
| Fijians | 0.0 /100 | #297 | Tragic 27.0% |
| Immigrants | Yemen | 0.0 /100 | #298 | Tragic 27.0% |
| Potawatomi | 0.0 /100 | #299 | Tragic 27.0% |