Bahamian vs Alaska Native Hearing Disability
COMPARE
Bahamian
Alaska Native
Hearing Disability
Hearing Disability Comparison
Bahamians
Alaska Natives
2.9%
HEARING DISABILITY
88.6/ 100
METRIC RATING
124th/ 347
METRIC RANK
4.5%
HEARING DISABILITY
0.0/ 100
METRIC RATING
338th/ 347
METRIC RANK
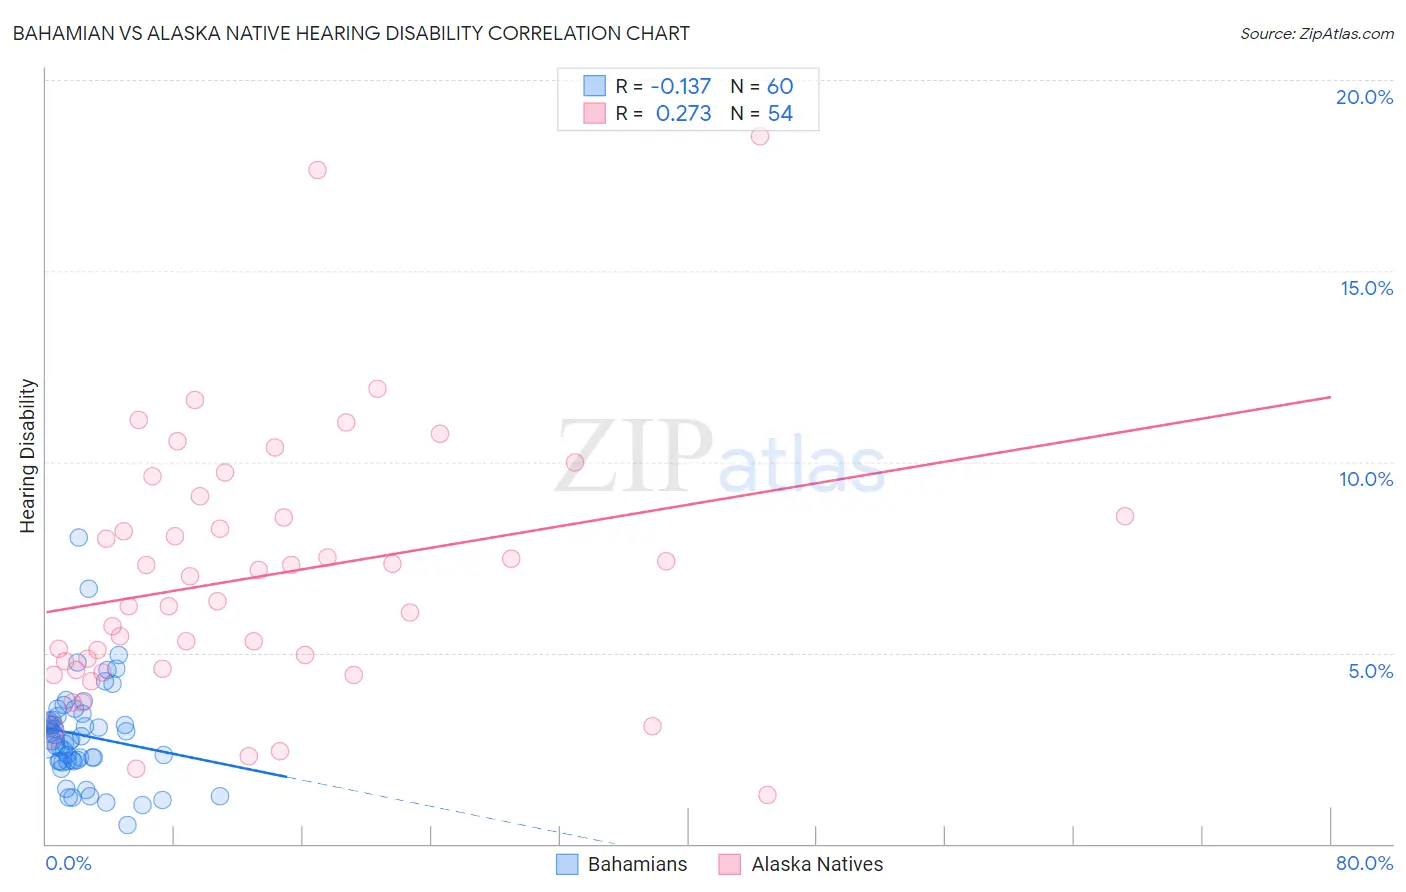
Bahamian vs Alaska Native Hearing Disability Correlation Chart
The statistical analysis conducted on geographies consisting of 112,647,902 people shows a poor negative correlation between the proportion of Bahamians and percentage of population with hearing disability in the United States with a correlation coefficient (R) of -0.137 and weighted average of 2.9%. Similarly, the statistical analysis conducted on geographies consisting of 76,760,957 people shows a weak positive correlation between the proportion of Alaska Natives and percentage of population with hearing disability in the United States with a correlation coefficient (R) of 0.273 and weighted average of 4.5%, a difference of 57.4%.
Hearing Disability Correlation Summary
| Measurement | Bahamian | Alaska Native |
| Minimum | 0.49% | 1.3% |
| Maximum | 8.0% | 18.5% |
| Range | 7.5% | 17.3% |
| Mean | 2.8% | 7.0% |
| Median | 2.7% | 6.7% |
| Interquartile 25% (IQ1) | 2.2% | 4.6% |
| Interquartile 75% (IQ3) | 3.3% | 8.6% |
| Interquartile Range (IQR) | 1.1% | 4.0% |
| Standard Deviation (Sample) | 1.3% | 3.4% |
| Standard Deviation (Population) | 1.3% | 3.4% |
Similar Demographics by Hearing Disability
Demographics Similar to Bahamians by Hearing Disability
In terms of hearing disability, the demographic groups most similar to Bahamians are Immigrants from Zaire (2.9%, a difference of 0.010%), Immigrants from Albania (2.9%, a difference of 0.030%), Liberian (2.8%, a difference of 0.10%), Cuban (2.8%, a difference of 0.19%), and Immigrants from Sudan (2.9%, a difference of 0.19%).
| Demographics | Rating | Rank | Hearing Disability |
| Immigrants | Liberia | 90.0 /100 | #117 | Excellent 2.8% |
| Zimbabweans | 89.9 /100 | #118 | Excellent 2.8% |
| Kenyans | 89.8 /100 | #119 | Excellent 2.8% |
| Jordanians | 89.5 /100 | #120 | Excellent 2.8% |
| Cubans | 89.4 /100 | #121 | Excellent 2.8% |
| Liberians | 89.0 /100 | #122 | Excellent 2.8% |
| Immigrants | Zaire | 88.6 /100 | #123 | Excellent 2.9% |
| Bahamians | 88.6 /100 | #124 | Excellent 2.9% |
| Immigrants | Albania | 88.5 /100 | #125 | Excellent 2.9% |
| Immigrants | Sudan | 87.8 /100 | #126 | Excellent 2.9% |
| South American Indians | 86.9 /100 | #127 | Excellent 2.9% |
| Immigrants | Western Asia | 86.9 /100 | #128 | Excellent 2.9% |
| Immigrants | Uganda | 86.6 /100 | #129 | Excellent 2.9% |
| Immigrants | Vietnam | 86.5 /100 | #130 | Excellent 2.9% |
| Immigrants | Kenya | 86.1 /100 | #131 | Excellent 2.9% |
Demographics Similar to Alaska Natives by Hearing Disability
In terms of hearing disability, the demographic groups most similar to Alaska Natives are Chickasaw (4.5%, a difference of 0.21%), Choctaw (4.5%, a difference of 1.4%), Creek (4.4%, a difference of 2.7%), Pueblo (4.6%, a difference of 2.9%), and Navajo (4.6%, a difference of 3.3%).
| Demographics | Rating | Rank | Hearing Disability |
| Cherokee | 0.0 /100 | #331 | Tragic 4.2% |
| Houma | 0.0 /100 | #332 | Tragic 4.2% |
| Dutch West Indians | 0.0 /100 | #333 | Tragic 4.3% |
| Aleuts | 0.0 /100 | #334 | Tragic 4.3% |
| Kiowa | 0.0 /100 | #335 | Tragic 4.3% |
| Creek | 0.0 /100 | #336 | Tragic 4.4% |
| Chickasaw | 0.0 /100 | #337 | Tragic 4.5% |
| Alaska Natives | 0.0 /100 | #338 | Tragic 4.5% |
| Choctaw | 0.0 /100 | #339 | Tragic 4.5% |
| Pueblo | 0.0 /100 | #340 | Tragic 4.6% |
| Navajo | 0.0 /100 | #341 | Tragic 4.6% |
| Tsimshian | 0.0 /100 | #342 | Tragic 4.7% |
| Inupiat | 0.0 /100 | #343 | Tragic 4.7% |
| Tlingit-Haida | 0.0 /100 | #344 | Tragic 4.8% |
| Alaskan Athabascans | 0.0 /100 | #345 | Tragic 5.3% |