Nigerian vs Alaska Native Hearing Disability
COMPARE
Nigerian
Alaska Native
Hearing Disability
Hearing Disability Comparison
Nigerians
Alaska Natives
2.6%
HEARING DISABILITY
99.4/ 100
METRIC RATING
44th/ 347
METRIC RANK
4.5%
HEARING DISABILITY
0.0/ 100
METRIC RATING
338th/ 347
METRIC RANK
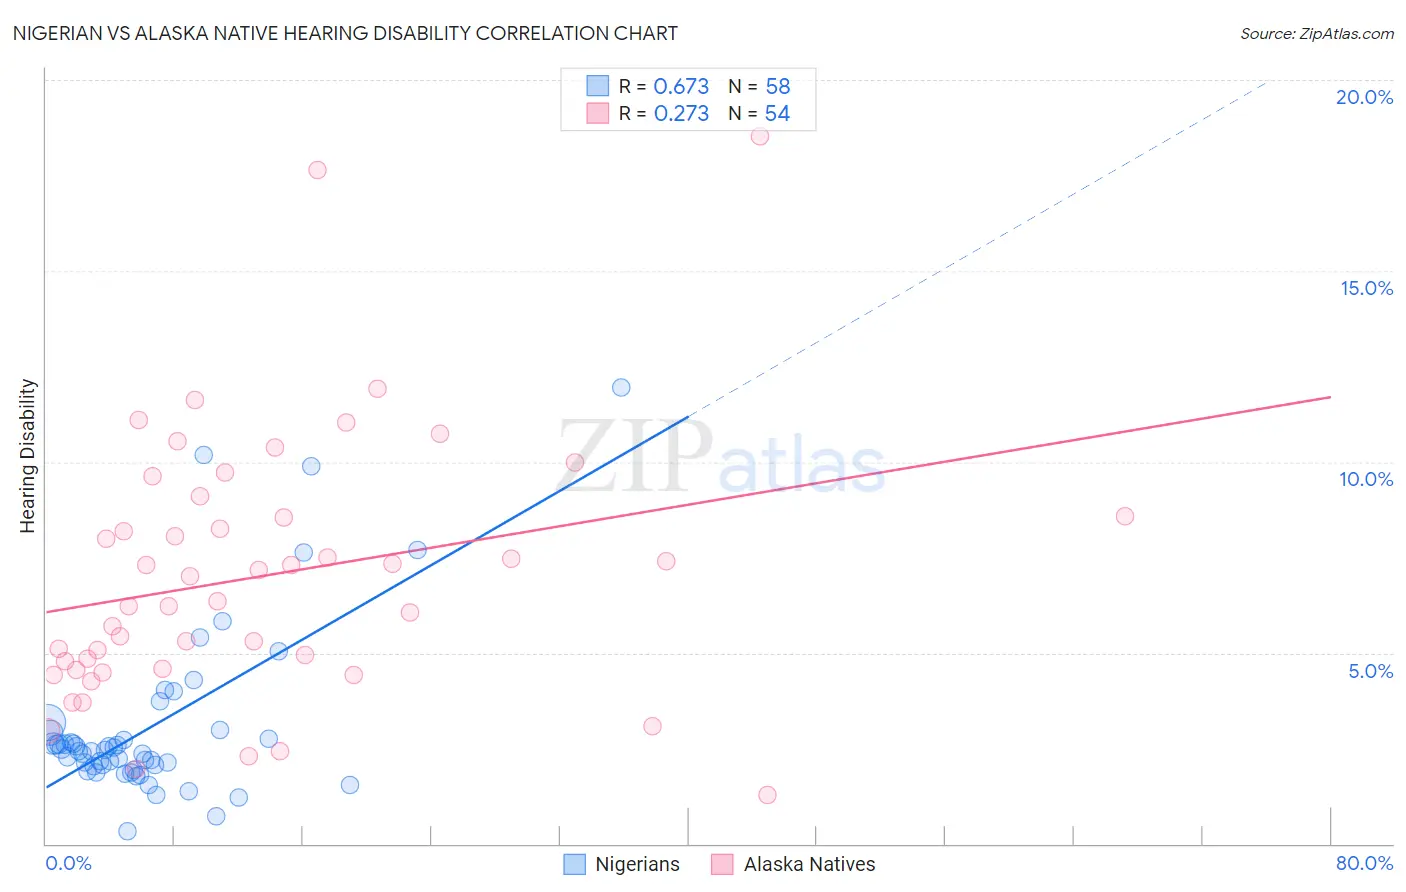
Nigerian vs Alaska Native Hearing Disability Correlation Chart
The statistical analysis conducted on geographies consisting of 332,627,178 people shows a significant positive correlation between the proportion of Nigerians and percentage of population with hearing disability in the United States with a correlation coefficient (R) of 0.673 and weighted average of 2.6%. Similarly, the statistical analysis conducted on geographies consisting of 76,760,957 people shows a weak positive correlation between the proportion of Alaska Natives and percentage of population with hearing disability in the United States with a correlation coefficient (R) of 0.273 and weighted average of 4.5%, a difference of 69.9%.
Hearing Disability Correlation Summary
| Measurement | Nigerian | Alaska Native |
| Minimum | 0.32% | 1.3% |
| Maximum | 11.9% | 18.5% |
| Range | 11.6% | 17.3% |
| Mean | 3.1% | 7.0% |
| Median | 2.4% | 6.7% |
| Interquartile 25% (IQ1) | 2.0% | 4.6% |
| Interquartile 75% (IQ3) | 2.9% | 8.6% |
| Interquartile Range (IQR) | 0.89% | 4.0% |
| Standard Deviation (Sample) | 2.3% | 3.4% |
| Standard Deviation (Population) | 2.2% | 3.4% |
Similar Demographics by Hearing Disability
Demographics Similar to Nigerians by Hearing Disability
In terms of hearing disability, the demographic groups most similar to Nigerians are Venezuelan (2.6%, a difference of 0.020%), Immigrants from Dominica (2.6%, a difference of 0.13%), Senegalese (2.6%, a difference of 0.22%), Immigrants from Taiwan (2.6%, a difference of 0.23%), and West Indian (2.6%, a difference of 0.23%).
| Demographics | Rating | Rank | Hearing Disability |
| Immigrants | Western Africa | 99.6 /100 | #37 | Exceptional 2.6% |
| Immigrants | Jamaica | 99.5 /100 | #38 | Exceptional 2.6% |
| Immigrants | China | 99.5 /100 | #39 | Exceptional 2.6% |
| Haitians | 99.5 /100 | #40 | Exceptional 2.6% |
| Immigrants | Taiwan | 99.4 /100 | #41 | Exceptional 2.6% |
| West Indians | 99.4 /100 | #42 | Exceptional 2.6% |
| Senegalese | 99.4 /100 | #43 | Exceptional 2.6% |
| Nigerians | 99.4 /100 | #44 | Exceptional 2.6% |
| Venezuelans | 99.4 /100 | #45 | Exceptional 2.6% |
| Immigrants | Dominica | 99.3 /100 | #46 | Exceptional 2.6% |
| Immigrants | Israel | 99.3 /100 | #47 | Exceptional 2.6% |
| Immigrants | Singapore | 99.3 /100 | #48 | Exceptional 2.6% |
| Immigrants | South America | 99.2 /100 | #49 | Exceptional 2.7% |
| Paraguayans | 99.2 /100 | #50 | Exceptional 2.7% |
| Immigrants | Hong Kong | 99.2 /100 | #51 | Exceptional 2.7% |
Demographics Similar to Alaska Natives by Hearing Disability
In terms of hearing disability, the demographic groups most similar to Alaska Natives are Chickasaw (4.5%, a difference of 0.21%), Choctaw (4.5%, a difference of 1.4%), Creek (4.4%, a difference of 2.7%), Pueblo (4.6%, a difference of 2.9%), and Navajo (4.6%, a difference of 3.3%).
| Demographics | Rating | Rank | Hearing Disability |
| Cherokee | 0.0 /100 | #331 | Tragic 4.2% |
| Houma | 0.0 /100 | #332 | Tragic 4.2% |
| Dutch West Indians | 0.0 /100 | #333 | Tragic 4.3% |
| Aleuts | 0.0 /100 | #334 | Tragic 4.3% |
| Kiowa | 0.0 /100 | #335 | Tragic 4.3% |
| Creek | 0.0 /100 | #336 | Tragic 4.4% |
| Chickasaw | 0.0 /100 | #337 | Tragic 4.5% |
| Alaska Natives | 0.0 /100 | #338 | Tragic 4.5% |
| Choctaw | 0.0 /100 | #339 | Tragic 4.5% |
| Pueblo | 0.0 /100 | #340 | Tragic 4.6% |
| Navajo | 0.0 /100 | #341 | Tragic 4.6% |
| Tsimshian | 0.0 /100 | #342 | Tragic 4.7% |
| Inupiat | 0.0 /100 | #343 | Tragic 4.7% |
| Tlingit-Haida | 0.0 /100 | #344 | Tragic 4.8% |
| Alaskan Athabascans | 0.0 /100 | #345 | Tragic 5.3% |