Bahamian vs Immigrants from Eastern Asia Hearing Disability
COMPARE
Bahamian
Immigrants from Eastern Asia
Hearing Disability
Hearing Disability Comparison
Bahamians
Immigrants from Eastern Asia
2.9%
HEARING DISABILITY
88.6/ 100
METRIC RATING
124th/ 347
METRIC RANK
2.7%
HEARING DISABILITY
99.0/ 100
METRIC RATING
53rd/ 347
METRIC RANK
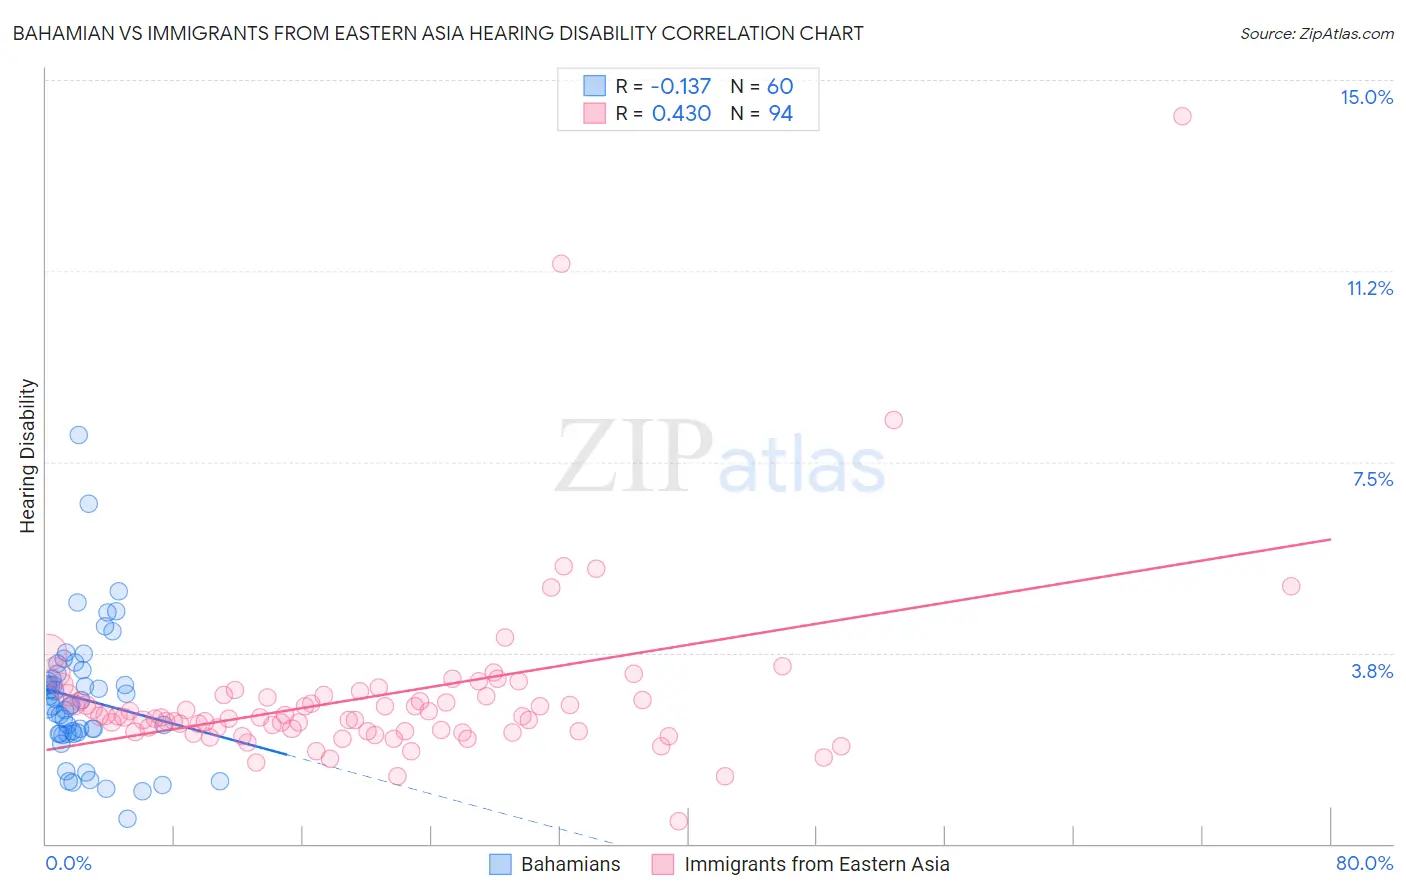
Bahamian vs Immigrants from Eastern Asia Hearing Disability Correlation Chart
The statistical analysis conducted on geographies consisting of 112,647,902 people shows a poor negative correlation between the proportion of Bahamians and percentage of population with hearing disability in the United States with a correlation coefficient (R) of -0.137 and weighted average of 2.9%. Similarly, the statistical analysis conducted on geographies consisting of 499,587,634 people shows a moderate positive correlation between the proportion of Immigrants from Eastern Asia and percentage of population with hearing disability in the United States with a correlation coefficient (R) of 0.430 and weighted average of 2.7%, a difference of 6.7%.
Hearing Disability Correlation Summary
| Measurement | Bahamian | Immigrants from Eastern Asia |
| Minimum | 0.49% | 0.45% |
| Maximum | 8.0% | 14.3% |
| Range | 7.5% | 13.8% |
| Mean | 2.8% | 2.9% |
| Median | 2.7% | 2.5% |
| Interquartile 25% (IQ1) | 2.2% | 2.2% |
| Interquartile 75% (IQ3) | 3.3% | 2.9% |
| Interquartile Range (IQR) | 1.1% | 0.71% |
| Standard Deviation (Sample) | 1.3% | 1.8% |
| Standard Deviation (Population) | 1.3% | 1.8% |
Similar Demographics by Hearing Disability
Demographics Similar to Bahamians by Hearing Disability
In terms of hearing disability, the demographic groups most similar to Bahamians are Immigrants from Zaire (2.9%, a difference of 0.010%), Immigrants from Albania (2.9%, a difference of 0.030%), Liberian (2.8%, a difference of 0.10%), Cuban (2.8%, a difference of 0.19%), and Immigrants from Sudan (2.9%, a difference of 0.19%).
| Demographics | Rating | Rank | Hearing Disability |
| Immigrants | Liberia | 90.0 /100 | #117 | Excellent 2.8% |
| Zimbabweans | 89.9 /100 | #118 | Excellent 2.8% |
| Kenyans | 89.8 /100 | #119 | Excellent 2.8% |
| Jordanians | 89.5 /100 | #120 | Excellent 2.8% |
| Cubans | 89.4 /100 | #121 | Excellent 2.8% |
| Liberians | 89.0 /100 | #122 | Excellent 2.8% |
| Immigrants | Zaire | 88.6 /100 | #123 | Excellent 2.9% |
| Bahamians | 88.6 /100 | #124 | Excellent 2.9% |
| Immigrants | Albania | 88.5 /100 | #125 | Excellent 2.9% |
| Immigrants | Sudan | 87.8 /100 | #126 | Excellent 2.9% |
| South American Indians | 86.9 /100 | #127 | Excellent 2.9% |
| Immigrants | Western Asia | 86.9 /100 | #128 | Excellent 2.9% |
| Immigrants | Uganda | 86.6 /100 | #129 | Excellent 2.9% |
| Immigrants | Vietnam | 86.5 /100 | #130 | Excellent 2.9% |
| Immigrants | Kenya | 86.1 /100 | #131 | Excellent 2.9% |
Demographics Similar to Immigrants from Eastern Asia by Hearing Disability
In terms of hearing disability, the demographic groups most similar to Immigrants from Eastern Asia are Ethiopian (2.7%, a difference of 0.030%), Jamaican (2.7%, a difference of 0.070%), Immigrants from Ethiopia (2.7%, a difference of 0.10%), Immigrants from Nicaragua (2.7%, a difference of 0.12%), and South American (2.7%, a difference of 0.16%).
| Demographics | Rating | Rank | Hearing Disability |
| Immigrants | Dominica | 99.3 /100 | #46 | Exceptional 2.6% |
| Immigrants | Israel | 99.3 /100 | #47 | Exceptional 2.6% |
| Immigrants | Singapore | 99.3 /100 | #48 | Exceptional 2.6% |
| Immigrants | South America | 99.2 /100 | #49 | Exceptional 2.7% |
| Paraguayans | 99.2 /100 | #50 | Exceptional 2.7% |
| Immigrants | Hong Kong | 99.2 /100 | #51 | Exceptional 2.7% |
| Jamaicans | 99.0 /100 | #52 | Exceptional 2.7% |
| Immigrants | Eastern Asia | 99.0 /100 | #53 | Exceptional 2.7% |
| Ethiopians | 99.0 /100 | #54 | Exceptional 2.7% |
| Immigrants | Ethiopia | 99.0 /100 | #55 | Exceptional 2.7% |
| Immigrants | Nicaragua | 99.0 /100 | #56 | Exceptional 2.7% |
| South Americans | 99.0 /100 | #57 | Exceptional 2.7% |
| Immigrants | Peru | 98.6 /100 | #58 | Exceptional 2.7% |
| Immigrants | Eritrea | 98.5 /100 | #59 | Exceptional 2.7% |
| Immigrants | Egypt | 98.5 /100 | #60 | Exceptional 2.7% |