Immigrants from Russia vs Alaska Native Hearing Disability
COMPARE
Immigrants from Russia
Alaska Native
Hearing Disability
Hearing Disability Comparison
Immigrants from Russia
Alaska Natives
2.9%
HEARING DISABILITY
77.7/ 100
METRIC RATING
148th/ 347
METRIC RANK
4.5%
HEARING DISABILITY
0.0/ 100
METRIC RATING
338th/ 347
METRIC RANK
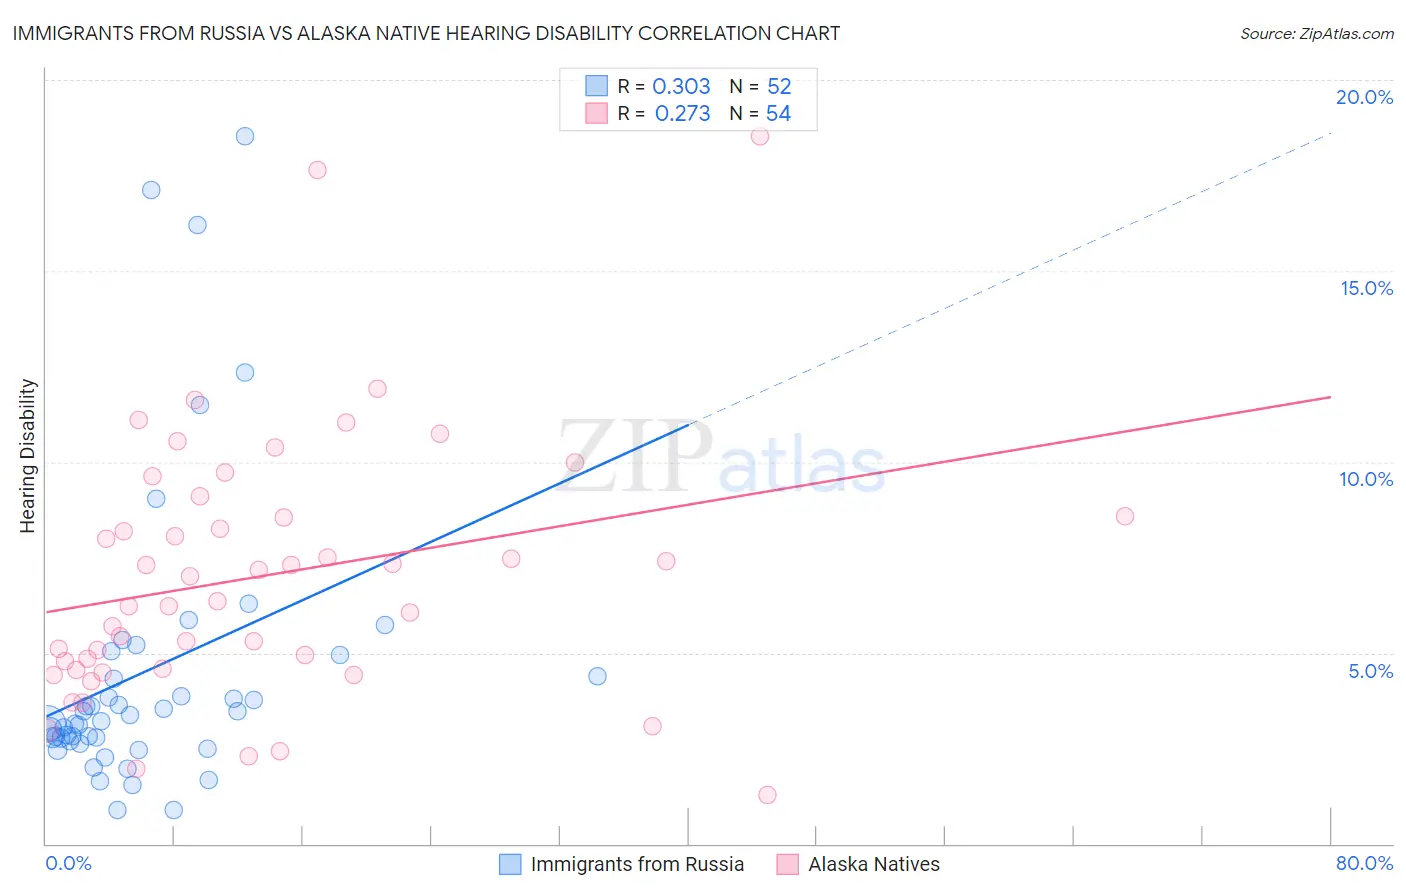
Immigrants from Russia vs Alaska Native Hearing Disability Correlation Chart
The statistical analysis conducted on geographies consisting of 347,834,739 people shows a mild positive correlation between the proportion of Immigrants from Russia and percentage of population with hearing disability in the United States with a correlation coefficient (R) of 0.303 and weighted average of 2.9%. Similarly, the statistical analysis conducted on geographies consisting of 76,760,957 people shows a weak positive correlation between the proportion of Alaska Natives and percentage of population with hearing disability in the United States with a correlation coefficient (R) of 0.273 and weighted average of 4.5%, a difference of 54.3%.
Hearing Disability Correlation Summary
| Measurement | Immigrants from Russia | Alaska Native |
| Minimum | 0.87% | 1.3% |
| Maximum | 18.5% | 18.5% |
| Range | 17.7% | 17.3% |
| Mean | 4.5% | 7.0% |
| Median | 3.3% | 6.7% |
| Interquartile 25% (IQ1) | 2.7% | 4.6% |
| Interquartile 75% (IQ3) | 4.7% | 8.6% |
| Interquartile Range (IQR) | 1.9% | 4.0% |
| Standard Deviation (Sample) | 3.9% | 3.4% |
| Standard Deviation (Population) | 3.8% | 3.4% |
Similar Demographics by Hearing Disability
Demographics Similar to Immigrants from Russia by Hearing Disability
In terms of hearing disability, the demographic groups most similar to Immigrants from Russia are Immigrants from Panama (2.9%, a difference of 0.11%), Tongan (2.9%, a difference of 0.13%), Brazilian (2.9%, a difference of 0.15%), Immigrants from Congo (2.9%, a difference of 0.17%), and Immigrants from Bulgaria (2.9%, a difference of 0.21%).
| Demographics | Rating | Rank | Hearing Disability |
| Sub-Saharan Africans | 83.3 /100 | #141 | Excellent 2.9% |
| Laotians | 81.1 /100 | #142 | Excellent 2.9% |
| Immigrants | Bahamas | 80.9 /100 | #143 | Excellent 2.9% |
| Immigrants | Bulgaria | 79.2 /100 | #144 | Good 2.9% |
| Immigrants | Congo | 78.9 /100 | #145 | Good 2.9% |
| Brazilians | 78.7 /100 | #146 | Good 2.9% |
| Tongans | 78.6 /100 | #147 | Good 2.9% |
| Immigrants | Russia | 77.7 /100 | #148 | Good 2.9% |
| Immigrants | Panama | 76.9 /100 | #149 | Good 2.9% |
| Palestinians | 73.6 /100 | #150 | Good 2.9% |
| Immigrants | France | 73.1 /100 | #151 | Good 2.9% |
| Immigrants | Lithuania | 73.0 /100 | #152 | Good 2.9% |
| Sudanese | 72.1 /100 | #153 | Good 2.9% |
| Immigrants | Lebanon | 71.5 /100 | #154 | Good 2.9% |
| Costa Ricans | 71.4 /100 | #155 | Good 2.9% |
Demographics Similar to Alaska Natives by Hearing Disability
In terms of hearing disability, the demographic groups most similar to Alaska Natives are Chickasaw (4.5%, a difference of 0.21%), Choctaw (4.5%, a difference of 1.4%), Creek (4.4%, a difference of 2.7%), Pueblo (4.6%, a difference of 2.9%), and Navajo (4.6%, a difference of 3.3%).
| Demographics | Rating | Rank | Hearing Disability |
| Cherokee | 0.0 /100 | #331 | Tragic 4.2% |
| Houma | 0.0 /100 | #332 | Tragic 4.2% |
| Dutch West Indians | 0.0 /100 | #333 | Tragic 4.3% |
| Aleuts | 0.0 /100 | #334 | Tragic 4.3% |
| Kiowa | 0.0 /100 | #335 | Tragic 4.3% |
| Creek | 0.0 /100 | #336 | Tragic 4.4% |
| Chickasaw | 0.0 /100 | #337 | Tragic 4.5% |
| Alaska Natives | 0.0 /100 | #338 | Tragic 4.5% |
| Choctaw | 0.0 /100 | #339 | Tragic 4.5% |
| Pueblo | 0.0 /100 | #340 | Tragic 4.6% |
| Navajo | 0.0 /100 | #341 | Tragic 4.6% |
| Tsimshian | 0.0 /100 | #342 | Tragic 4.7% |
| Inupiat | 0.0 /100 | #343 | Tragic 4.7% |
| Tlingit-Haida | 0.0 /100 | #344 | Tragic 4.8% |
| Alaskan Athabascans | 0.0 /100 | #345 | Tragic 5.3% |