Bahamian vs Immigrants from Sierra Leone Hearing Disability
COMPARE
Bahamian
Immigrants from Sierra Leone
Hearing Disability
Hearing Disability Comparison
Bahamians
Immigrants from Sierra Leone
2.9%
HEARING DISABILITY
88.6/ 100
METRIC RATING
124th/ 347
METRIC RANK
2.6%
HEARING DISABILITY
99.8/ 100
METRIC RATING
22nd/ 347
METRIC RANK
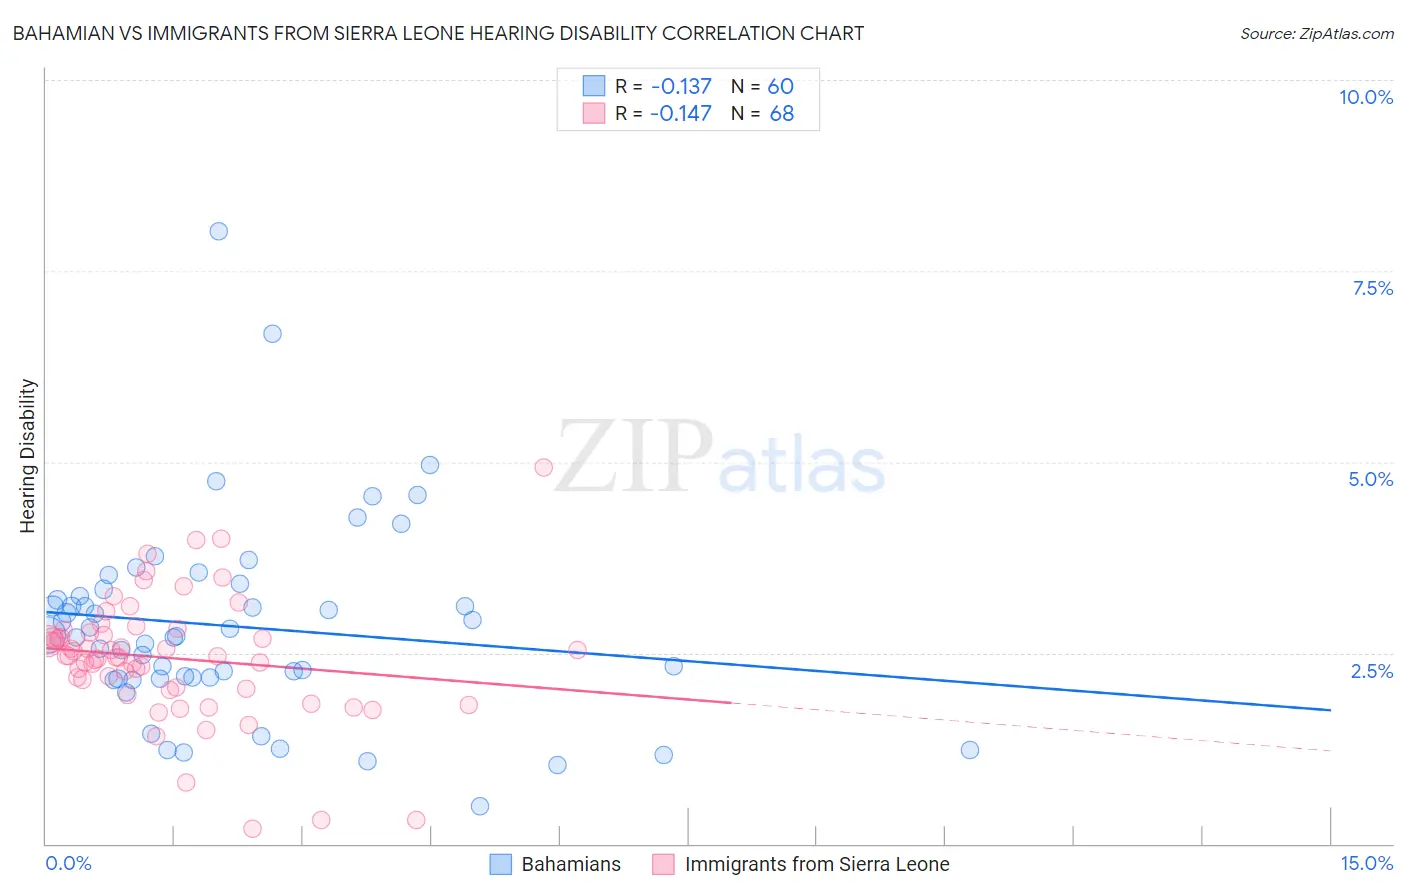
Bahamian vs Immigrants from Sierra Leone Hearing Disability Correlation Chart
The statistical analysis conducted on geographies consisting of 112,647,902 people shows a poor negative correlation between the proportion of Bahamians and percentage of population with hearing disability in the United States with a correlation coefficient (R) of -0.137 and weighted average of 2.9%. Similarly, the statistical analysis conducted on geographies consisting of 101,639,141 people shows a poor negative correlation between the proportion of Immigrants from Sierra Leone and percentage of population with hearing disability in the United States with a correlation coefficient (R) of -0.147 and weighted average of 2.6%, a difference of 11.8%.
Hearing Disability Correlation Summary
| Measurement | Bahamian | Immigrants from Sierra Leone |
| Minimum | 0.49% | 0.20% |
| Maximum | 8.0% | 4.9% |
| Range | 7.5% | 4.7% |
| Mean | 2.8% | 2.4% |
| Median | 2.7% | 2.5% |
| Interquartile 25% (IQ1) | 2.2% | 2.0% |
| Interquartile 75% (IQ3) | 3.3% | 2.8% |
| Interquartile Range (IQR) | 1.1% | 0.72% |
| Standard Deviation (Sample) | 1.3% | 0.81% |
| Standard Deviation (Population) | 1.3% | 0.80% |
Similar Demographics by Hearing Disability
Demographics Similar to Bahamians by Hearing Disability
In terms of hearing disability, the demographic groups most similar to Bahamians are Immigrants from Zaire (2.9%, a difference of 0.010%), Immigrants from Albania (2.9%, a difference of 0.030%), Liberian (2.8%, a difference of 0.10%), Cuban (2.8%, a difference of 0.19%), and Immigrants from Sudan (2.9%, a difference of 0.19%).
| Demographics | Rating | Rank | Hearing Disability |
| Immigrants | Liberia | 90.0 /100 | #117 | Excellent 2.8% |
| Zimbabweans | 89.9 /100 | #118 | Excellent 2.8% |
| Kenyans | 89.8 /100 | #119 | Excellent 2.8% |
| Jordanians | 89.5 /100 | #120 | Excellent 2.8% |
| Cubans | 89.4 /100 | #121 | Excellent 2.8% |
| Liberians | 89.0 /100 | #122 | Excellent 2.8% |
| Immigrants | Zaire | 88.6 /100 | #123 | Excellent 2.9% |
| Bahamians | 88.6 /100 | #124 | Excellent 2.9% |
| Immigrants | Albania | 88.5 /100 | #125 | Excellent 2.9% |
| Immigrants | Sudan | 87.8 /100 | #126 | Excellent 2.9% |
| South American Indians | 86.9 /100 | #127 | Excellent 2.9% |
| Immigrants | Western Asia | 86.9 /100 | #128 | Excellent 2.9% |
| Immigrants | Uganda | 86.6 /100 | #129 | Excellent 2.9% |
| Immigrants | Vietnam | 86.5 /100 | #130 | Excellent 2.9% |
| Immigrants | Kenya | 86.1 /100 | #131 | Excellent 2.9% |
Demographics Similar to Immigrants from Sierra Leone by Hearing Disability
In terms of hearing disability, the demographic groups most similar to Immigrants from Sierra Leone are Ghanaian (2.5%, a difference of 0.040%), Immigrants from Bolivia (2.5%, a difference of 0.11%), Thai (2.5%, a difference of 0.16%), Dominican (2.5%, a difference of 0.18%), and Immigrants from Nigeria (2.6%, a difference of 0.50%).
| Demographics | Rating | Rank | Hearing Disability |
| Barbadians | 99.9 /100 | #15 | Exceptional 2.5% |
| Immigrants | West Indies | 99.9 /100 | #16 | Exceptional 2.5% |
| Immigrants | India | 99.9 /100 | #17 | Exceptional 2.5% |
| Dominicans | 99.8 /100 | #18 | Exceptional 2.5% |
| Thais | 99.8 /100 | #19 | Exceptional 2.5% |
| Immigrants | Bolivia | 99.8 /100 | #20 | Exceptional 2.5% |
| Ghanaians | 99.8 /100 | #21 | Exceptional 2.5% |
| Immigrants | Sierra Leone | 99.8 /100 | #22 | Exceptional 2.6% |
| Immigrants | Nigeria | 99.8 /100 | #23 | Exceptional 2.6% |
| Immigrants | Ghana | 99.8 /100 | #24 | Exceptional 2.6% |
| Immigrants | El Salvador | 99.7 /100 | #25 | Exceptional 2.6% |
| Immigrants | Senegal | 99.7 /100 | #26 | Exceptional 2.6% |
| Immigrants | South Central Asia | 99.7 /100 | #27 | Exceptional 2.6% |
| Immigrants | Haiti | 99.7 /100 | #28 | Exceptional 2.6% |
| Bolivians | 99.7 /100 | #29 | Exceptional 2.6% |