Blackfeet vs Alaska Native Hearing Disability
COMPARE
Blackfeet
Alaska Native
Hearing Disability
Hearing Disability Comparison
Blackfeet
Alaska Natives
3.6%
HEARING DISABILITY
0.0/ 100
METRIC RATING
283rd/ 347
METRIC RANK
4.5%
HEARING DISABILITY
0.0/ 100
METRIC RATING
338th/ 347
METRIC RANK
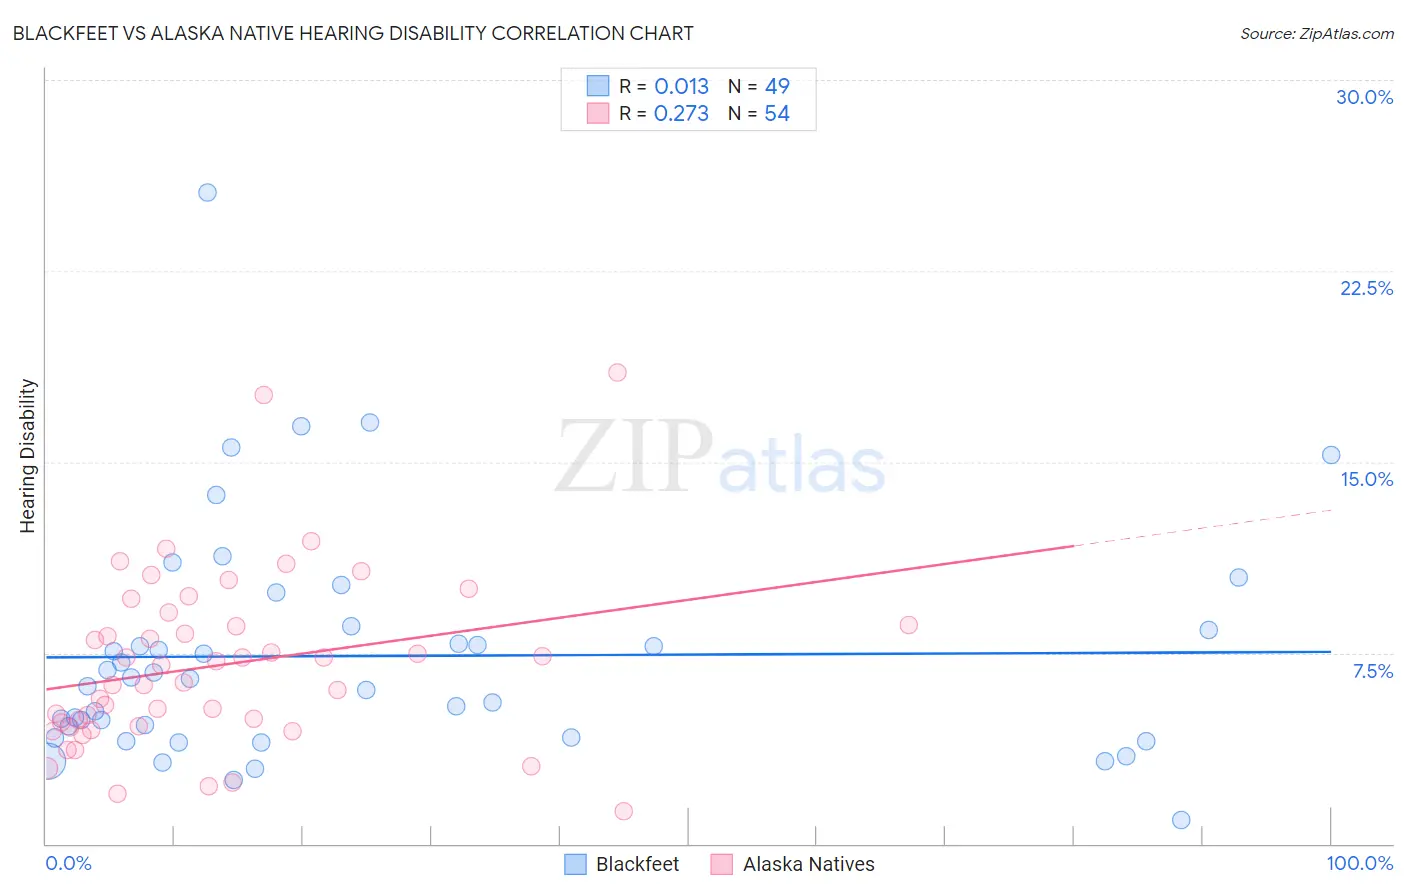
Blackfeet vs Alaska Native Hearing Disability Correlation Chart
The statistical analysis conducted on geographies consisting of 309,445,553 people shows no correlation between the proportion of Blackfeet and percentage of population with hearing disability in the United States with a correlation coefficient (R) of 0.013 and weighted average of 3.6%. Similarly, the statistical analysis conducted on geographies consisting of 76,760,957 people shows a weak positive correlation between the proportion of Alaska Natives and percentage of population with hearing disability in the United States with a correlation coefficient (R) of 0.273 and weighted average of 4.5%, a difference of 23.9%.
Hearing Disability Correlation Summary
| Measurement | Blackfeet | Alaska Native |
| Minimum | 0.91% | 1.3% |
| Maximum | 25.6% | 18.5% |
| Range | 24.7% | 17.3% |
| Mean | 7.4% | 7.0% |
| Median | 6.5% | 6.7% |
| Interquartile 25% (IQ1) | 4.2% | 4.6% |
| Interquartile 75% (IQ3) | 8.5% | 8.6% |
| Interquartile Range (IQR) | 4.3% | 4.0% |
| Standard Deviation (Sample) | 4.6% | 3.4% |
| Standard Deviation (Population) | 4.5% | 3.4% |
Similar Demographics by Hearing Disability
Demographics Similar to Blackfeet by Hearing Disability
In terms of hearing disability, the demographic groups most similar to Blackfeet are Swedish (3.6%, a difference of 0.25%), Scandinavian (3.6%, a difference of 0.34%), French American Indian (3.6%, a difference of 0.40%), Slovak (3.6%, a difference of 0.46%), and Immigrants from Micronesia (3.6%, a difference of 0.47%).
| Demographics | Rating | Rank | Hearing Disability |
| Danes | 0.0 /100 | #276 | Tragic 3.6% |
| Immigrants | Nonimmigrants | 0.0 /100 | #277 | Tragic 3.6% |
| Basques | 0.0 /100 | #278 | Tragic 3.6% |
| Slovaks | 0.0 /100 | #279 | Tragic 3.6% |
| French American Indians | 0.0 /100 | #280 | Tragic 3.6% |
| Scandinavians | 0.0 /100 | #281 | Tragic 3.6% |
| Swedes | 0.0 /100 | #282 | Tragic 3.6% |
| Blackfeet | 0.0 /100 | #283 | Tragic 3.6% |
| Immigrants | Micronesia | 0.0 /100 | #284 | Tragic 3.6% |
| Sioux | 0.0 /100 | #285 | Tragic 3.6% |
| Delaware | 0.0 /100 | #286 | Tragic 3.6% |
| Spanish | 0.0 /100 | #287 | Tragic 3.7% |
| Irish | 0.0 /100 | #288 | Tragic 3.7% |
| Chinese | 0.0 /100 | #289 | Tragic 3.7% |
| Whites/Caucasians | 0.0 /100 | #290 | Tragic 3.7% |
Demographics Similar to Alaska Natives by Hearing Disability
In terms of hearing disability, the demographic groups most similar to Alaska Natives are Chickasaw (4.5%, a difference of 0.21%), Choctaw (4.5%, a difference of 1.4%), Creek (4.4%, a difference of 2.7%), Pueblo (4.6%, a difference of 2.9%), and Navajo (4.6%, a difference of 3.3%).
| Demographics | Rating | Rank | Hearing Disability |
| Cherokee | 0.0 /100 | #331 | Tragic 4.2% |
| Houma | 0.0 /100 | #332 | Tragic 4.2% |
| Dutch West Indians | 0.0 /100 | #333 | Tragic 4.3% |
| Aleuts | 0.0 /100 | #334 | Tragic 4.3% |
| Kiowa | 0.0 /100 | #335 | Tragic 4.3% |
| Creek | 0.0 /100 | #336 | Tragic 4.4% |
| Chickasaw | 0.0 /100 | #337 | Tragic 4.5% |
| Alaska Natives | 0.0 /100 | #338 | Tragic 4.5% |
| Choctaw | 0.0 /100 | #339 | Tragic 4.5% |
| Pueblo | 0.0 /100 | #340 | Tragic 4.6% |
| Navajo | 0.0 /100 | #341 | Tragic 4.6% |
| Tsimshian | 0.0 /100 | #342 | Tragic 4.7% |
| Inupiat | 0.0 /100 | #343 | Tragic 4.7% |
| Tlingit-Haida | 0.0 /100 | #344 | Tragic 4.8% |
| Alaskan Athabascans | 0.0 /100 | #345 | Tragic 5.3% |