Immigrants from Philippines vs Alaska Native Hearing Disability
COMPARE
Immigrants from Philippines
Alaska Native
Hearing Disability
Hearing Disability Comparison
Immigrants from Philippines
Alaska Natives
3.0%
HEARING DISABILITY
46.4/ 100
METRIC RATING
177th/ 347
METRIC RANK
4.5%
HEARING DISABILITY
0.0/ 100
METRIC RATING
338th/ 347
METRIC RANK
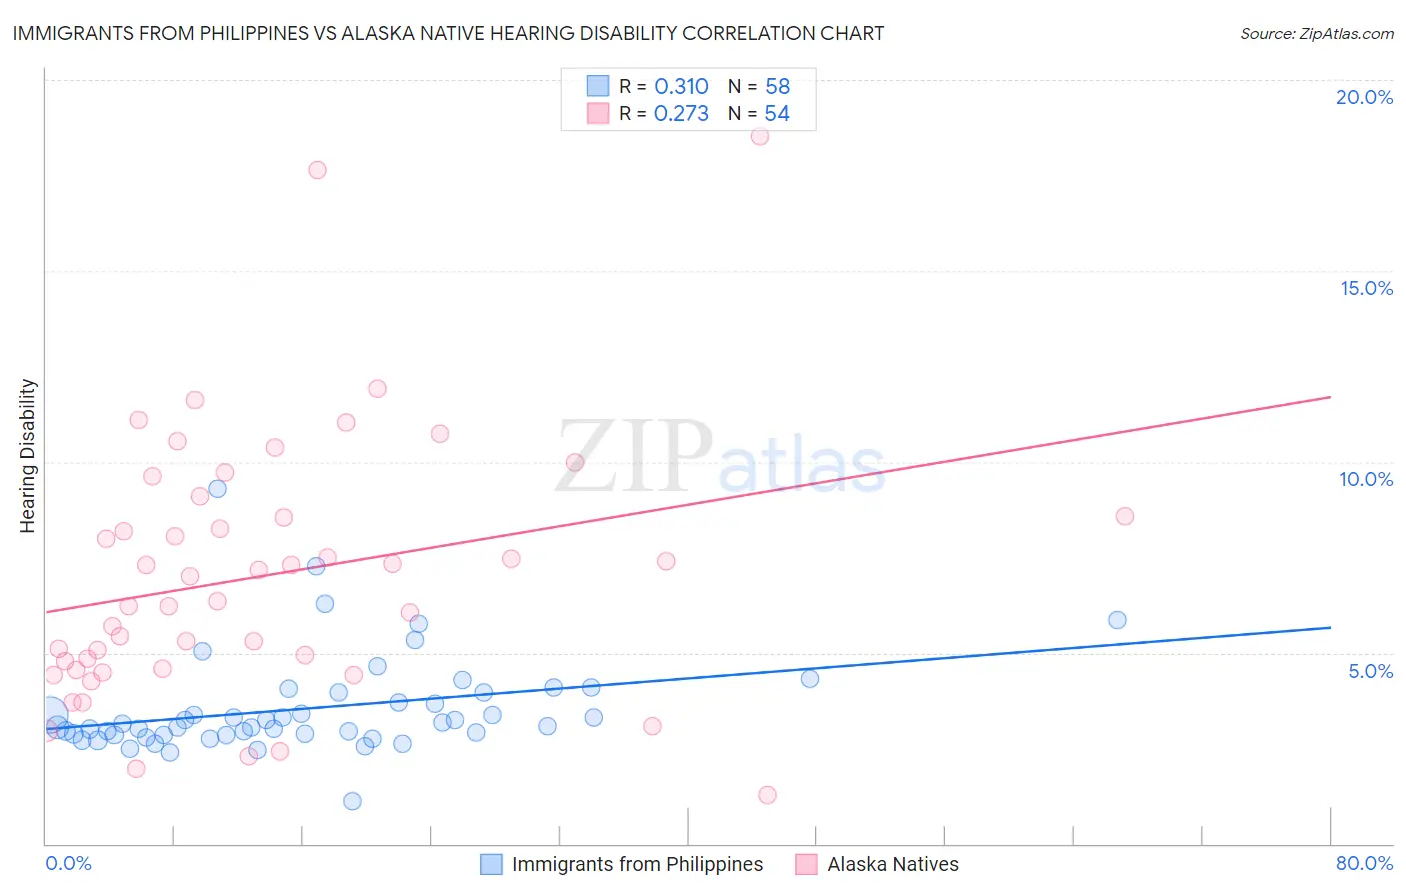
Immigrants from Philippines vs Alaska Native Hearing Disability Correlation Chart
The statistical analysis conducted on geographies consisting of 471,004,648 people shows a mild positive correlation between the proportion of Immigrants from Philippines and percentage of population with hearing disability in the United States with a correlation coefficient (R) of 0.310 and weighted average of 3.0%. Similarly, the statistical analysis conducted on geographies consisting of 76,760,957 people shows a weak positive correlation between the proportion of Alaska Natives and percentage of population with hearing disability in the United States with a correlation coefficient (R) of 0.273 and weighted average of 4.5%, a difference of 49.3%.
Hearing Disability Correlation Summary
| Measurement | Immigrants from Philippines | Alaska Native |
| Minimum | 1.1% | 1.3% |
| Maximum | 9.3% | 18.5% |
| Range | 8.2% | 17.3% |
| Mean | 3.5% | 7.0% |
| Median | 3.1% | 6.7% |
| Interquartile 25% (IQ1) | 2.8% | 4.6% |
| Interquartile 75% (IQ3) | 4.0% | 8.6% |
| Interquartile Range (IQR) | 1.1% | 4.0% |
| Standard Deviation (Sample) | 1.3% | 3.4% |
| Standard Deviation (Population) | 1.3% | 3.4% |
Similar Demographics by Hearing Disability
Demographics Similar to Immigrants from Philippines by Hearing Disability
In terms of hearing disability, the demographic groups most similar to Immigrants from Philippines are Japanese (3.0%, a difference of 0.040%), Panamanian (3.0%, a difference of 0.060%), Immigrants from Romania (3.0%, a difference of 0.20%), Immigrants from Moldova (3.0%, a difference of 0.31%), and Indonesian (3.0%, a difference of 0.34%).
| Demographics | Rating | Rank | Hearing Disability |
| Immigrants | Cabo Verde | 56.9 /100 | #170 | Average 3.0% |
| Immigrants | Ukraine | 56.6 /100 | #171 | Average 3.0% |
| Armenians | 56.0 /100 | #172 | Average 3.0% |
| Immigrants | Serbia | 51.1 /100 | #173 | Average 3.0% |
| Indonesians | 50.0 /100 | #174 | Average 3.0% |
| Immigrants | Romania | 48.4 /100 | #175 | Average 3.0% |
| Panamanians | 47.0 /100 | #176 | Average 3.0% |
| Immigrants | Philippines | 46.4 /100 | #177 | Average 3.0% |
| Japanese | 46.0 /100 | #178 | Average 3.0% |
| Immigrants | Moldova | 43.1 /100 | #179 | Average 3.0% |
| Immigrants | Sweden | 42.4 /100 | #180 | Average 3.0% |
| Immigrants | Belgium | 41.5 /100 | #181 | Average 3.0% |
| Immigrants | Italy | 41.1 /100 | #182 | Average 3.0% |
| Bulgarians | 39.7 /100 | #183 | Fair 3.0% |
| Immigrants | Ireland | 37.4 /100 | #184 | Fair 3.0% |
Demographics Similar to Alaska Natives by Hearing Disability
In terms of hearing disability, the demographic groups most similar to Alaska Natives are Chickasaw (4.5%, a difference of 0.21%), Choctaw (4.5%, a difference of 1.4%), Creek (4.4%, a difference of 2.7%), Pueblo (4.6%, a difference of 2.9%), and Navajo (4.6%, a difference of 3.3%).
| Demographics | Rating | Rank | Hearing Disability |
| Cherokee | 0.0 /100 | #331 | Tragic 4.2% |
| Houma | 0.0 /100 | #332 | Tragic 4.2% |
| Dutch West Indians | 0.0 /100 | #333 | Tragic 4.3% |
| Aleuts | 0.0 /100 | #334 | Tragic 4.3% |
| Kiowa | 0.0 /100 | #335 | Tragic 4.3% |
| Creek | 0.0 /100 | #336 | Tragic 4.4% |
| Chickasaw | 0.0 /100 | #337 | Tragic 4.5% |
| Alaska Natives | 0.0 /100 | #338 | Tragic 4.5% |
| Choctaw | 0.0 /100 | #339 | Tragic 4.5% |
| Pueblo | 0.0 /100 | #340 | Tragic 4.6% |
| Navajo | 0.0 /100 | #341 | Tragic 4.6% |
| Tsimshian | 0.0 /100 | #342 | Tragic 4.7% |
| Inupiat | 0.0 /100 | #343 | Tragic 4.7% |
| Tlingit-Haida | 0.0 /100 | #344 | Tragic 4.8% |
| Alaskan Athabascans | 0.0 /100 | #345 | Tragic 5.3% |