Bahamian vs Alaska Native Disability Age 18 to 34
COMPARE
Bahamian
Alaska Native
Disability Age 18 to 34
Disability Age 18 to 34 Comparison
Bahamians
Alaska Natives
6.6%
DISABILITY AGE 18 TO 34
55.5/ 100
METRIC RATING
171st/ 347
METRIC RANK
7.8%
DISABILITY AGE 18 TO 34
0.0/ 100
METRIC RATING
309th/ 347
METRIC RANK
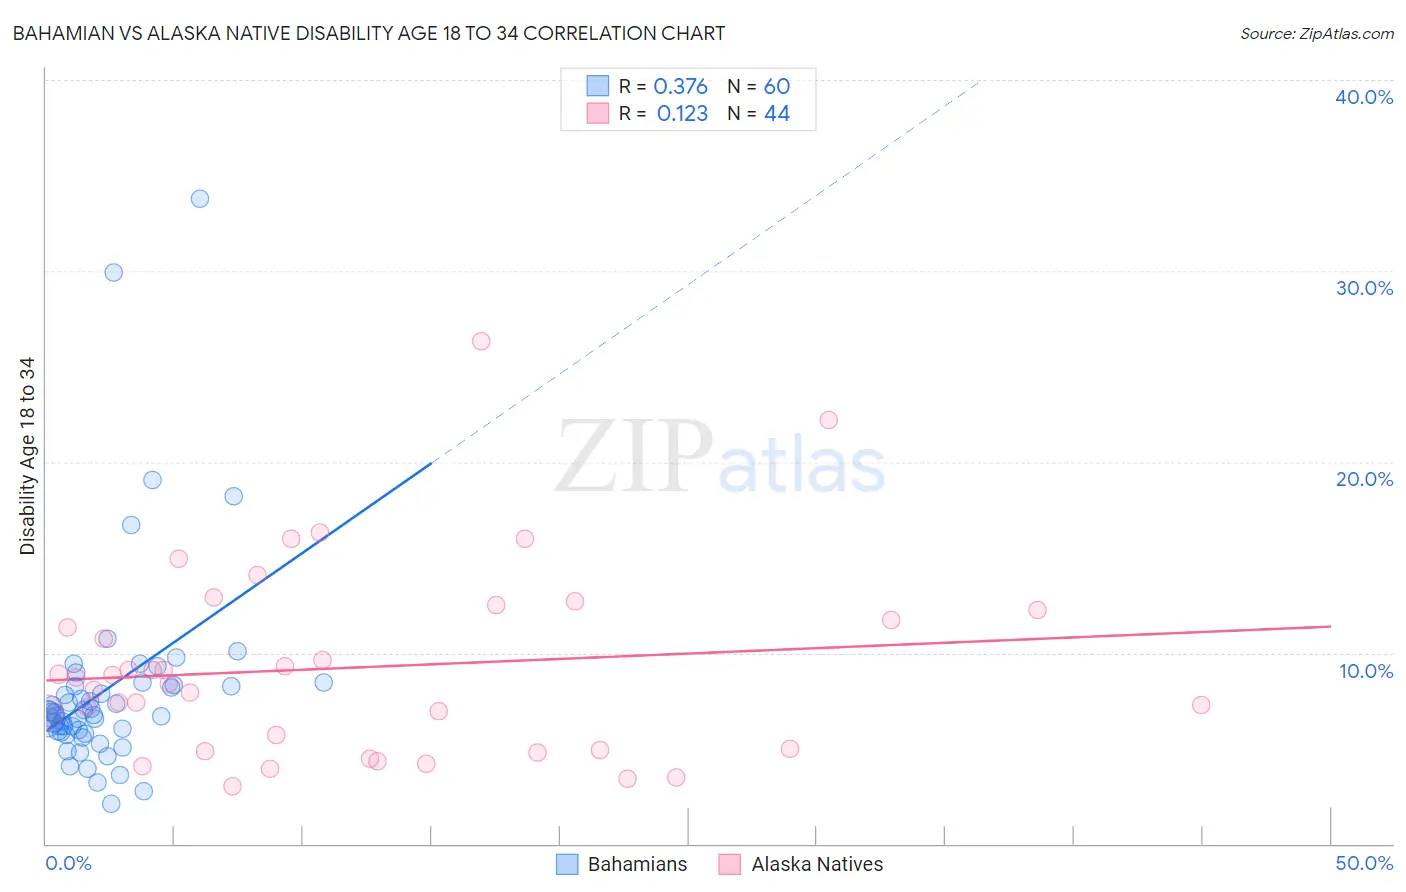
Bahamian vs Alaska Native Disability Age 18 to 34 Correlation Chart
The statistical analysis conducted on geographies consisting of 112,638,340 people shows a mild positive correlation between the proportion of Bahamians and percentage of population with a disability between the ages 18 and 35 in the United States with a correlation coefficient (R) of 0.376 and weighted average of 6.6%. Similarly, the statistical analysis conducted on geographies consisting of 76,695,131 people shows a poor positive correlation between the proportion of Alaska Natives and percentage of population with a disability between the ages 18 and 35 in the United States with a correlation coefficient (R) of 0.123 and weighted average of 7.8%, a difference of 18.8%.
Disability Age 18 to 34 Correlation Summary
| Measurement | Bahamian | Alaska Native |
| Minimum | 2.1% | 3.0% |
| Maximum | 33.8% | 26.3% |
| Range | 31.7% | 23.3% |
| Mean | 8.1% | 9.2% |
| Median | 6.8% | 8.6% |
| Interquartile 25% (IQ1) | 5.9% | 4.9% |
| Interquartile 75% (IQ3) | 8.3% | 12.0% |
| Interquartile Range (IQR) | 2.4% | 7.1% |
| Standard Deviation (Sample) | 5.4% | 5.0% |
| Standard Deviation (Population) | 5.4% | 4.9% |
Similar Demographics by Disability Age 18 to 34
Demographics Similar to Bahamians by Disability Age 18 to 34
In terms of disability age 18 to 34, the demographic groups most similar to Bahamians are Ghanaian (6.6%, a difference of 0.050%), Immigrants from Mexico (6.6%, a difference of 0.10%), Immigrants from Bahamas (6.6%, a difference of 0.17%), Russian (6.5%, a difference of 0.34%), and Native Hawaiian (6.6%, a difference of 0.38%).
| Demographics | Rating | Rank | Disability Age 18 to 34 |
| Immigrants | Nigeria | 70.4 /100 | #164 | Good 6.5% |
| Immigrants | Hungary | 69.6 /100 | #165 | Good 6.5% |
| Eastern Europeans | 65.1 /100 | #166 | Good 6.5% |
| Immigrants | Northern Europe | 64.1 /100 | #167 | Good 6.5% |
| Immigrants | Moldova | 63.1 /100 | #168 | Good 6.5% |
| Russians | 60.2 /100 | #169 | Good 6.5% |
| Immigrants | Bahamas | 57.9 /100 | #170 | Average 6.6% |
| Bahamians | 55.5 /100 | #171 | Average 6.6% |
| Ghanaians | 54.7 /100 | #172 | Average 6.6% |
| Immigrants | Mexico | 54.1 /100 | #173 | Average 6.6% |
| Native Hawaiians | 50.0 /100 | #174 | Average 6.6% |
| Immigrants | Cambodia | 46.5 /100 | #175 | Average 6.6% |
| Immigrants | Africa | 45.9 /100 | #176 | Average 6.6% |
| Syrians | 44.3 /100 | #177 | Average 6.6% |
| Nigerians | 43.7 /100 | #178 | Average 6.6% |
Demographics Similar to Alaska Natives by Disability Age 18 to 34
In terms of disability age 18 to 34, the demographic groups most similar to Alaska Natives are Pennsylvania German (7.8%, a difference of 0.010%), Scotch-Irish (7.8%, a difference of 0.040%), Finnish (7.8%, a difference of 0.060%), English (7.8%, a difference of 0.30%), and Menominee (7.8%, a difference of 0.38%).
| Demographics | Rating | Rank | Disability Age 18 to 34 |
| Welsh | 0.0 /100 | #302 | Tragic 7.7% |
| Cheyenne | 0.0 /100 | #303 | Tragic 7.7% |
| Shoshone | 0.0 /100 | #304 | Tragic 7.8% |
| Menominee | 0.0 /100 | #305 | Tragic 7.8% |
| English | 0.0 /100 | #306 | Tragic 7.8% |
| Scotch-Irish | 0.0 /100 | #307 | Tragic 7.8% |
| Pennsylvania Germans | 0.0 /100 | #308 | Tragic 7.8% |
| Alaska Natives | 0.0 /100 | #309 | Tragic 7.8% |
| Finns | 0.0 /100 | #310 | Tragic 7.8% |
| French | 0.0 /100 | #311 | Tragic 7.9% |
| Spanish Americans | 0.0 /100 | #312 | Tragic 7.9% |
| Iroquois | 0.0 /100 | #313 | Tragic 7.9% |
| Colville | 0.0 /100 | #314 | Tragic 7.9% |
| Americans | 0.0 /100 | #315 | Tragic 8.0% |
| Puerto Ricans | 0.0 /100 | #316 | Tragic 8.0% |