Immigrants from Colombia vs Syrian Disability
COMPARE
Immigrants from Colombia
Syrian
Disability
Disability Comparison
Immigrants from Colombia
Syrians
10.9%
DISABILITY
99.7/ 100
METRIC RATING
59th/ 347
METRIC RANK
11.7%
DISABILITY
58.5/ 100
METRIC RATING
164th/ 347
METRIC RANK
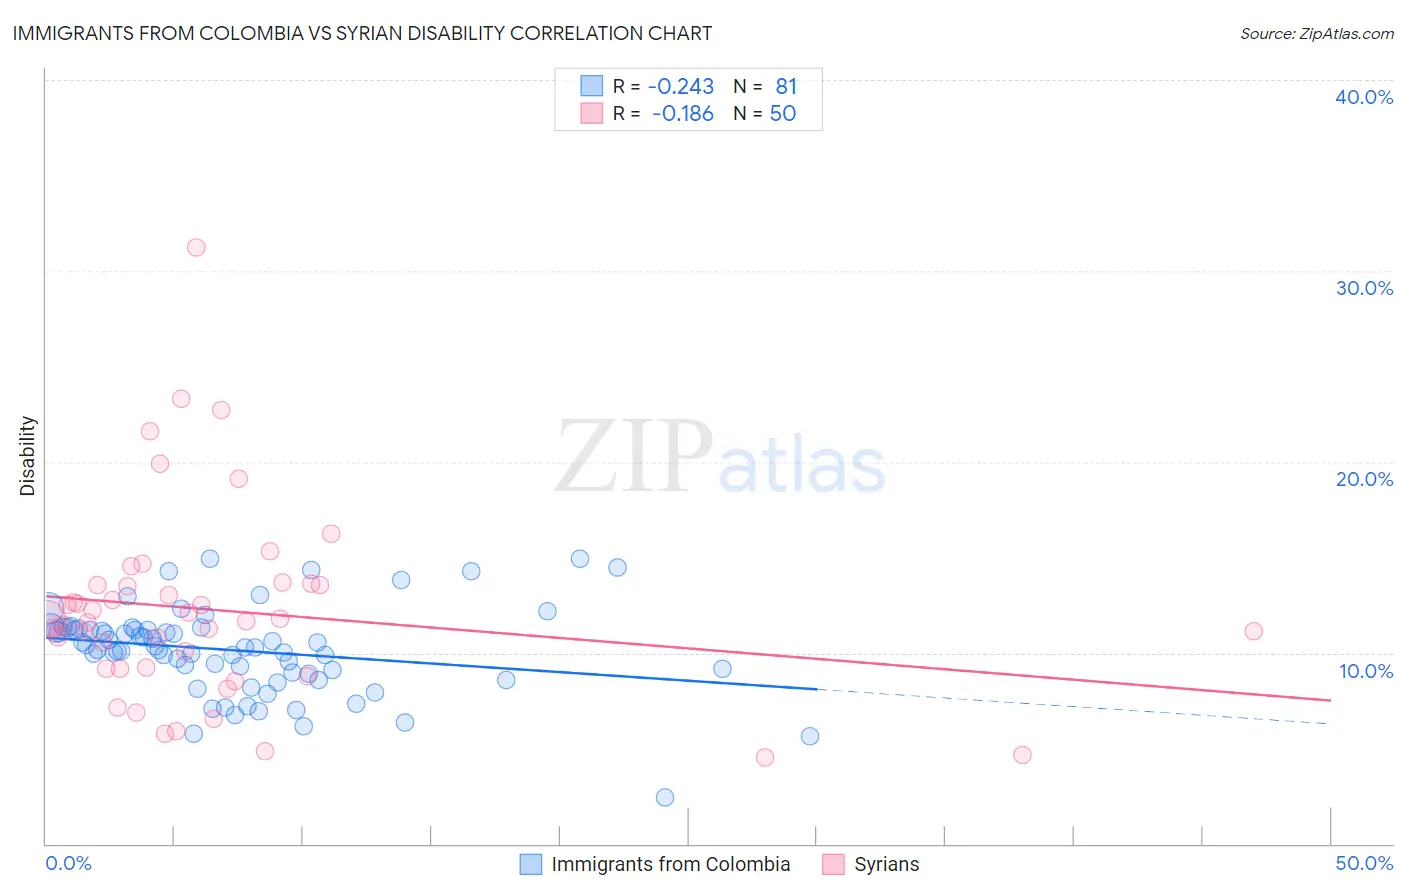
Immigrants from Colombia vs Syrian Disability Correlation Chart
The statistical analysis conducted on geographies consisting of 378,650,675 people shows a weak negative correlation between the proportion of Immigrants from Colombia and percentage of population with a disability in the United States with a correlation coefficient (R) of -0.243 and weighted average of 10.9%. Similarly, the statistical analysis conducted on geographies consisting of 266,315,243 people shows a poor negative correlation between the proportion of Syrians and percentage of population with a disability in the United States with a correlation coefficient (R) of -0.186 and weighted average of 11.7%, a difference of 6.7%.
Disability Correlation Summary
| Measurement | Immigrants from Colombia | Syrian |
| Minimum | 2.4% | 4.5% |
| Maximum | 14.9% | 31.2% |
| Range | 12.5% | 26.7% |
| Mean | 10.1% | 12.2% |
| Median | 10.3% | 11.7% |
| Interquartile 25% (IQ1) | 8.9% | 9.2% |
| Interquartile 75% (IQ3) | 11.2% | 13.6% |
| Interquartile Range (IQR) | 2.3% | 4.4% |
| Standard Deviation (Sample) | 2.3% | 5.1% |
| Standard Deviation (Population) | 2.3% | 5.0% |
Similar Demographics by Disability
Demographics Similar to Immigrants from Colombia by Disability
In terms of disability, the demographic groups most similar to Immigrants from Colombia are Immigrants from South America (10.9%, a difference of 0.090%), Zimbabwean (10.9%, a difference of 0.090%), Salvadoran (10.9%, a difference of 0.12%), Immigrants from Bulgaria (10.9%, a difference of 0.15%), and Immigrants from Northern Africa (10.9%, a difference of 0.19%).
| Demographics | Rating | Rank | Disability |
| South Americans | 99.8 /100 | #52 | Exceptional 10.9% |
| Immigrants | Spain | 99.8 /100 | #53 | Exceptional 10.9% |
| Jordanians | 99.8 /100 | #54 | Exceptional 10.9% |
| Immigrants | El Salvador | 99.8 /100 | #55 | Exceptional 10.9% |
| Immigrants | Lithuania | 99.8 /100 | #56 | Exceptional 10.9% |
| Salvadorans | 99.8 /100 | #57 | Exceptional 10.9% |
| Immigrants | South America | 99.8 /100 | #58 | Exceptional 10.9% |
| Immigrants | Colombia | 99.7 /100 | #59 | Exceptional 10.9% |
| Zimbabweans | 99.7 /100 | #60 | Exceptional 10.9% |
| Immigrants | Bulgaria | 99.7 /100 | #61 | Exceptional 10.9% |
| Immigrants | Northern Africa | 99.7 /100 | #62 | Exceptional 10.9% |
| Immigrants | Eritrea | 99.7 /100 | #63 | Exceptional 11.0% |
| Immigrants | Sweden | 99.6 /100 | #64 | Exceptional 11.0% |
| Bulgarians | 99.6 /100 | #65 | Exceptional 11.0% |
| Laotians | 99.6 /100 | #66 | Exceptional 11.0% |
Demographics Similar to Syrians by Disability
In terms of disability, the demographic groups most similar to Syrians are Immigrants from Trinidad and Tobago (11.7%, a difference of 0.020%), Immigrants from Haiti (11.7%, a difference of 0.030%), Cuban (11.7%, a difference of 0.080%), Pakistani (11.7%, a difference of 0.17%), and Estonian (11.7%, a difference of 0.18%).
| Demographics | Rating | Rank | Disability |
| Immigrants | Middle Africa | 69.5 /100 | #157 | Good 11.6% |
| Armenians | 65.9 /100 | #158 | Good 11.6% |
| Guatemalans | 65.1 /100 | #159 | Good 11.6% |
| Immigrants | Barbados | 64.2 /100 | #160 | Good 11.6% |
| Immigrants | Cuba | 62.8 /100 | #161 | Good 11.6% |
| Immigrants | Haiti | 59.2 /100 | #162 | Average 11.7% |
| Immigrants | Trinidad and Tobago | 58.9 /100 | #163 | Average 11.7% |
| Syrians | 58.5 /100 | #164 | Average 11.7% |
| Cubans | 56.7 /100 | #165 | Average 11.7% |
| Pakistanis | 54.7 /100 | #166 | Average 11.7% |
| Estonians | 54.4 /100 | #167 | Average 11.7% |
| Immigrants | Latin America | 54.1 /100 | #168 | Average 11.7% |
| Immigrants | Austria | 53.4 /100 | #169 | Average 11.7% |
| Immigrants | Albania | 52.8 /100 | #170 | Average 11.7% |
| Immigrants | Southern Europe | 52.8 /100 | #171 | Average 11.7% |