Asian vs Syrian Disability
COMPARE
Asian
Syrian
Disability
Disability Comparison
Asians
Syrians
10.4%
DISABILITY
100.0/ 100
METRIC RATING
21st/ 347
METRIC RANK
11.7%
DISABILITY
58.5/ 100
METRIC RATING
164th/ 347
METRIC RANK
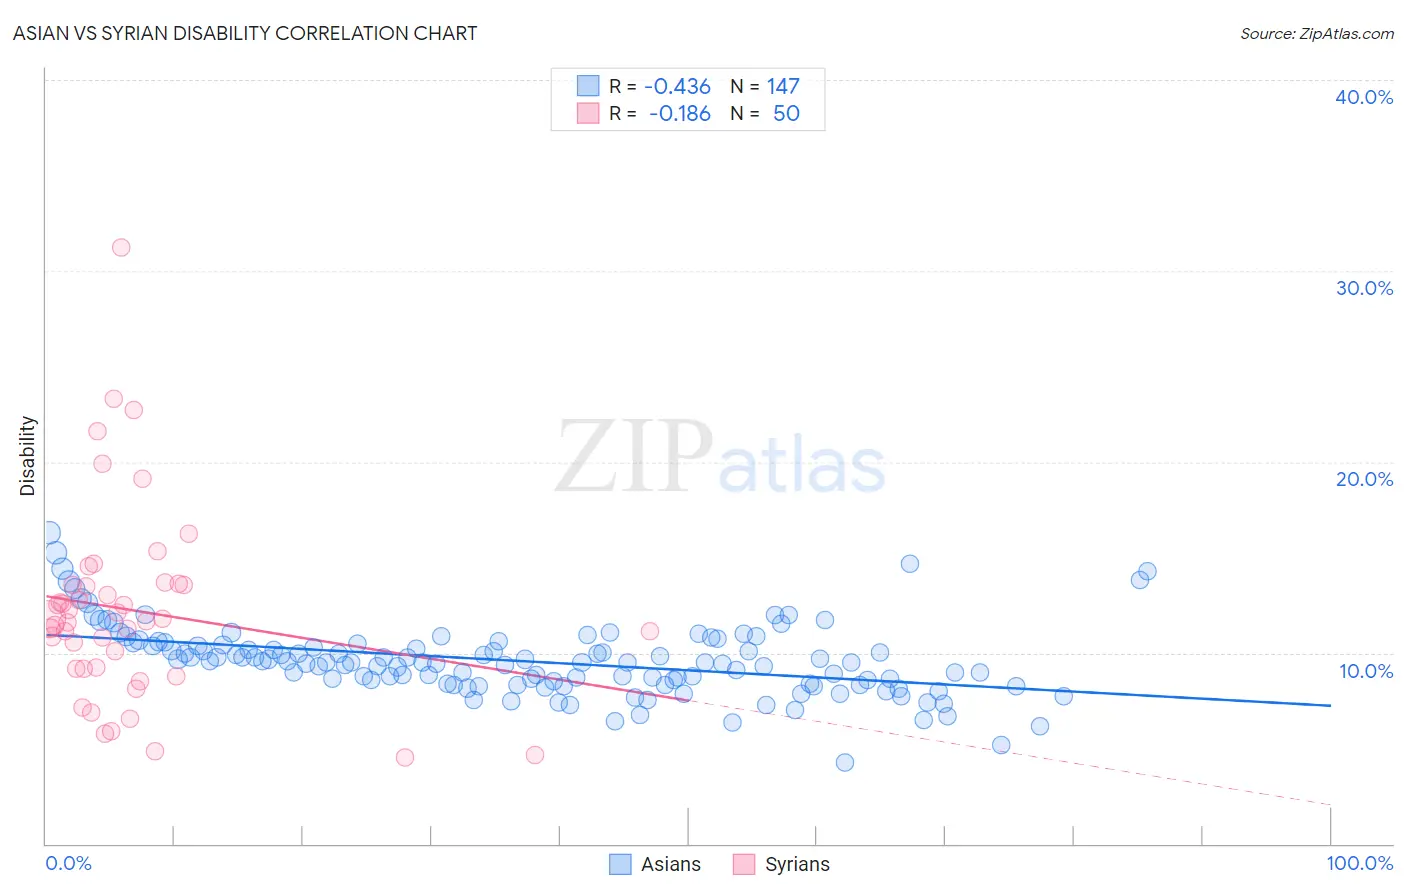
Asian vs Syrian Disability Correlation Chart
The statistical analysis conducted on geographies consisting of 550,807,105 people shows a moderate negative correlation between the proportion of Asians and percentage of population with a disability in the United States with a correlation coefficient (R) of -0.436 and weighted average of 10.4%. Similarly, the statistical analysis conducted on geographies consisting of 266,315,243 people shows a poor negative correlation between the proportion of Syrians and percentage of population with a disability in the United States with a correlation coefficient (R) of -0.186 and weighted average of 11.7%, a difference of 11.6%.
Disability Correlation Summary
| Measurement | Asian | Syrian |
| Minimum | 4.2% | 4.5% |
| Maximum | 16.3% | 31.2% |
| Range | 12.0% | 26.7% |
| Mean | 9.6% | 12.2% |
| Median | 9.5% | 11.7% |
| Interquartile 25% (IQ1) | 8.4% | 9.2% |
| Interquartile 75% (IQ3) | 10.4% | 13.6% |
| Interquartile Range (IQR) | 2.1% | 4.4% |
| Standard Deviation (Sample) | 1.9% | 5.1% |
| Standard Deviation (Population) | 1.9% | 5.0% |
Similar Demographics by Disability
Demographics Similar to Asians by Disability
In terms of disability, the demographic groups most similar to Asians are Immigrants from Venezuela (10.4%, a difference of 0.030%), Immigrants from Sri Lanka (10.5%, a difference of 0.10%), Burmese (10.4%, a difference of 0.72%), Immigrants from Pakistan (10.4%, a difference of 0.72%), and Immigrants from Asia (10.5%, a difference of 0.80%).
| Demographics | Rating | Rank | Disability |
| Immigrants | Korea | 100.0 /100 | #14 | Exceptional 10.2% |
| Okinawans | 100.0 /100 | #15 | Exceptional 10.3% |
| Indians (Asian) | 100.0 /100 | #16 | Exceptional 10.3% |
| Immigrants | Iran | 100.0 /100 | #17 | Exceptional 10.3% |
| Burmese | 100.0 /100 | #18 | Exceptional 10.4% |
| Immigrants | Pakistan | 100.0 /100 | #19 | Exceptional 10.4% |
| Immigrants | Venezuela | 100.0 /100 | #20 | Exceptional 10.4% |
| Asians | 100.0 /100 | #21 | Exceptional 10.4% |
| Immigrants | Sri Lanka | 100.0 /100 | #22 | Exceptional 10.5% |
| Immigrants | Asia | 100.0 /100 | #23 | Exceptional 10.5% |
| Venezuelans | 100.0 /100 | #24 | Exceptional 10.5% |
| Immigrants | Malaysia | 100.0 /100 | #25 | Exceptional 10.6% |
| Argentineans | 100.0 /100 | #26 | Exceptional 10.6% |
| Cypriots | 100.0 /100 | #27 | Exceptional 10.6% |
| Egyptians | 100.0 /100 | #28 | Exceptional 10.6% |
Demographics Similar to Syrians by Disability
In terms of disability, the demographic groups most similar to Syrians are Immigrants from Trinidad and Tobago (11.7%, a difference of 0.020%), Immigrants from Haiti (11.7%, a difference of 0.030%), Cuban (11.7%, a difference of 0.080%), Pakistani (11.7%, a difference of 0.17%), and Estonian (11.7%, a difference of 0.18%).
| Demographics | Rating | Rank | Disability |
| Immigrants | Middle Africa | 69.5 /100 | #157 | Good 11.6% |
| Armenians | 65.9 /100 | #158 | Good 11.6% |
| Guatemalans | 65.1 /100 | #159 | Good 11.6% |
| Immigrants | Barbados | 64.2 /100 | #160 | Good 11.6% |
| Immigrants | Cuba | 62.8 /100 | #161 | Good 11.6% |
| Immigrants | Haiti | 59.2 /100 | #162 | Average 11.7% |
| Immigrants | Trinidad and Tobago | 58.9 /100 | #163 | Average 11.7% |
| Syrians | 58.5 /100 | #164 | Average 11.7% |
| Cubans | 56.7 /100 | #165 | Average 11.7% |
| Pakistanis | 54.7 /100 | #166 | Average 11.7% |
| Estonians | 54.4 /100 | #167 | Average 11.7% |
| Immigrants | Latin America | 54.1 /100 | #168 | Average 11.7% |
| Immigrants | Austria | 53.4 /100 | #169 | Average 11.7% |
| Immigrants | Albania | 52.8 /100 | #170 | Average 11.7% |
| Immigrants | Southern Europe | 52.8 /100 | #171 | Average 11.7% |