Austrian vs Syrian Disability
COMPARE
Austrian
Syrian
Disability
Disability Comparison
Austrians
Syrians
12.0%
DISABILITY
7.2/ 100
METRIC RATING
212th/ 347
METRIC RANK
11.7%
DISABILITY
58.5/ 100
METRIC RATING
164th/ 347
METRIC RANK
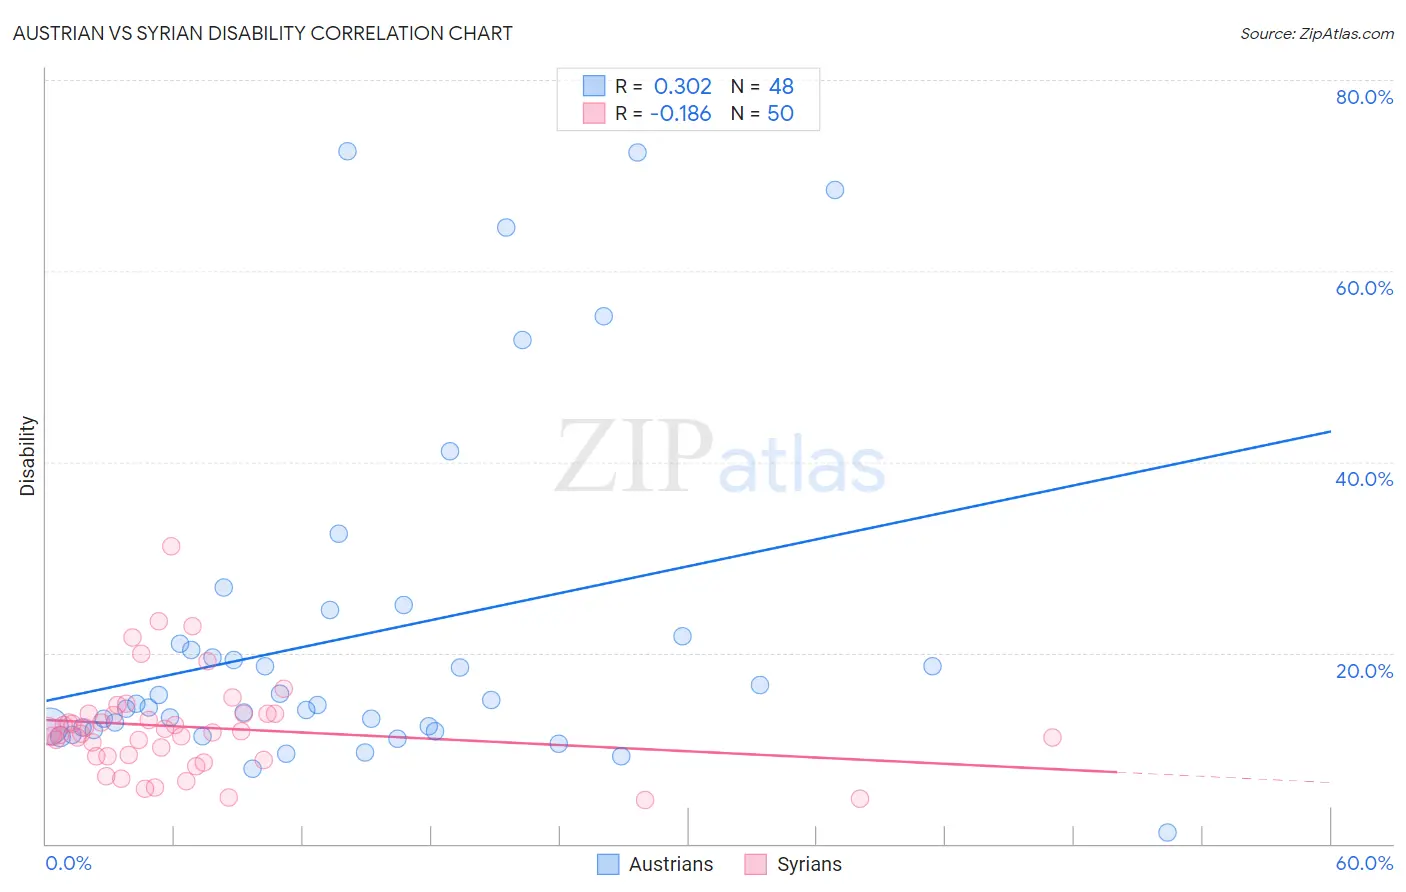
Austrian vs Syrian Disability Correlation Chart
The statistical analysis conducted on geographies consisting of 452,057,102 people shows a mild positive correlation between the proportion of Austrians and percentage of population with a disability in the United States with a correlation coefficient (R) of 0.302 and weighted average of 12.0%. Similarly, the statistical analysis conducted on geographies consisting of 266,315,243 people shows a poor negative correlation between the proportion of Syrians and percentage of population with a disability in the United States with a correlation coefficient (R) of -0.186 and weighted average of 11.7%, a difference of 3.2%.
Disability Correlation Summary
| Measurement | Austrian | Syrian |
| Minimum | 1.2% | 4.5% |
| Maximum | 72.5% | 31.2% |
| Range | 71.4% | 26.7% |
| Mean | 21.8% | 12.2% |
| Median | 14.6% | 11.7% |
| Interquartile 25% (IQ1) | 12.1% | 9.2% |
| Interquartile 75% (IQ3) | 21.4% | 13.6% |
| Interquartile Range (IQR) | 9.3% | 4.4% |
| Standard Deviation (Sample) | 17.7% | 5.1% |
| Standard Deviation (Population) | 17.5% | 5.0% |
Similar Demographics by Disability
Demographics Similar to Austrians by Disability
In terms of disability, the demographic groups most similar to Austrians are Immigrants from Iraq (12.0%, a difference of 0.010%), Immigrants from Cambodia (12.0%, a difference of 0.030%), Immigrants from Somalia (12.0%, a difference of 0.060%), Czech (12.0%, a difference of 0.11%), and Immigrants from Canada (12.1%, a difference of 0.18%).
| Demographics | Rating | Rank | Disability |
| Immigrants | Western Europe | 10.1 /100 | #205 | Poor 12.0% |
| Immigrants | Senegal | 9.4 /100 | #206 | Tragic 12.0% |
| Immigrants | Thailand | 9.3 /100 | #207 | Tragic 12.0% |
| Immigrants | Caribbean | 9.1 /100 | #208 | Tragic 12.0% |
| Danes | 8.7 /100 | #209 | Tragic 12.0% |
| Czechs | 7.9 /100 | #210 | Tragic 12.0% |
| Immigrants | Cambodia | 7.3 /100 | #211 | Tragic 12.0% |
| Austrians | 7.2 /100 | #212 | Tragic 12.0% |
| Immigrants | Iraq | 7.1 /100 | #213 | Tragic 12.0% |
| Immigrants | Somalia | 6.8 /100 | #214 | Tragic 12.0% |
| Immigrants | Canada | 6.1 /100 | #215 | Tragic 12.1% |
| Panamanians | 5.4 /100 | #216 | Tragic 12.1% |
| Immigrants | North America | 5.3 /100 | #217 | Tragic 12.1% |
| Immigrants | Jamaica | 5.0 /100 | #218 | Tragic 12.1% |
| Croatians | 4.9 /100 | #219 | Tragic 12.1% |
Demographics Similar to Syrians by Disability
In terms of disability, the demographic groups most similar to Syrians are Immigrants from Trinidad and Tobago (11.7%, a difference of 0.020%), Immigrants from Haiti (11.7%, a difference of 0.030%), Cuban (11.7%, a difference of 0.080%), Pakistani (11.7%, a difference of 0.17%), and Estonian (11.7%, a difference of 0.18%).
| Demographics | Rating | Rank | Disability |
| Immigrants | Middle Africa | 69.5 /100 | #157 | Good 11.6% |
| Armenians | 65.9 /100 | #158 | Good 11.6% |
| Guatemalans | 65.1 /100 | #159 | Good 11.6% |
| Immigrants | Barbados | 64.2 /100 | #160 | Good 11.6% |
| Immigrants | Cuba | 62.8 /100 | #161 | Good 11.6% |
| Immigrants | Haiti | 59.2 /100 | #162 | Average 11.7% |
| Immigrants | Trinidad and Tobago | 58.9 /100 | #163 | Average 11.7% |
| Syrians | 58.5 /100 | #164 | Average 11.7% |
| Cubans | 56.7 /100 | #165 | Average 11.7% |
| Pakistanis | 54.7 /100 | #166 | Average 11.7% |
| Estonians | 54.4 /100 | #167 | Average 11.7% |
| Immigrants | Latin America | 54.1 /100 | #168 | Average 11.7% |
| Immigrants | Austria | 53.4 /100 | #169 | Average 11.7% |
| Immigrants | Albania | 52.8 /100 | #170 | Average 11.7% |
| Immigrants | Southern Europe | 52.8 /100 | #171 | Average 11.7% |