Immigrants vs Syrian Disability
COMPARE
Immigrants
Syrian
Disability
Disability Comparison
Immigrants
Syrians
11.3%
DISABILITY
96.4/ 100
METRIC RATING
104th/ 347
METRIC RANK
11.7%
DISABILITY
58.5/ 100
METRIC RATING
164th/ 347
METRIC RANK
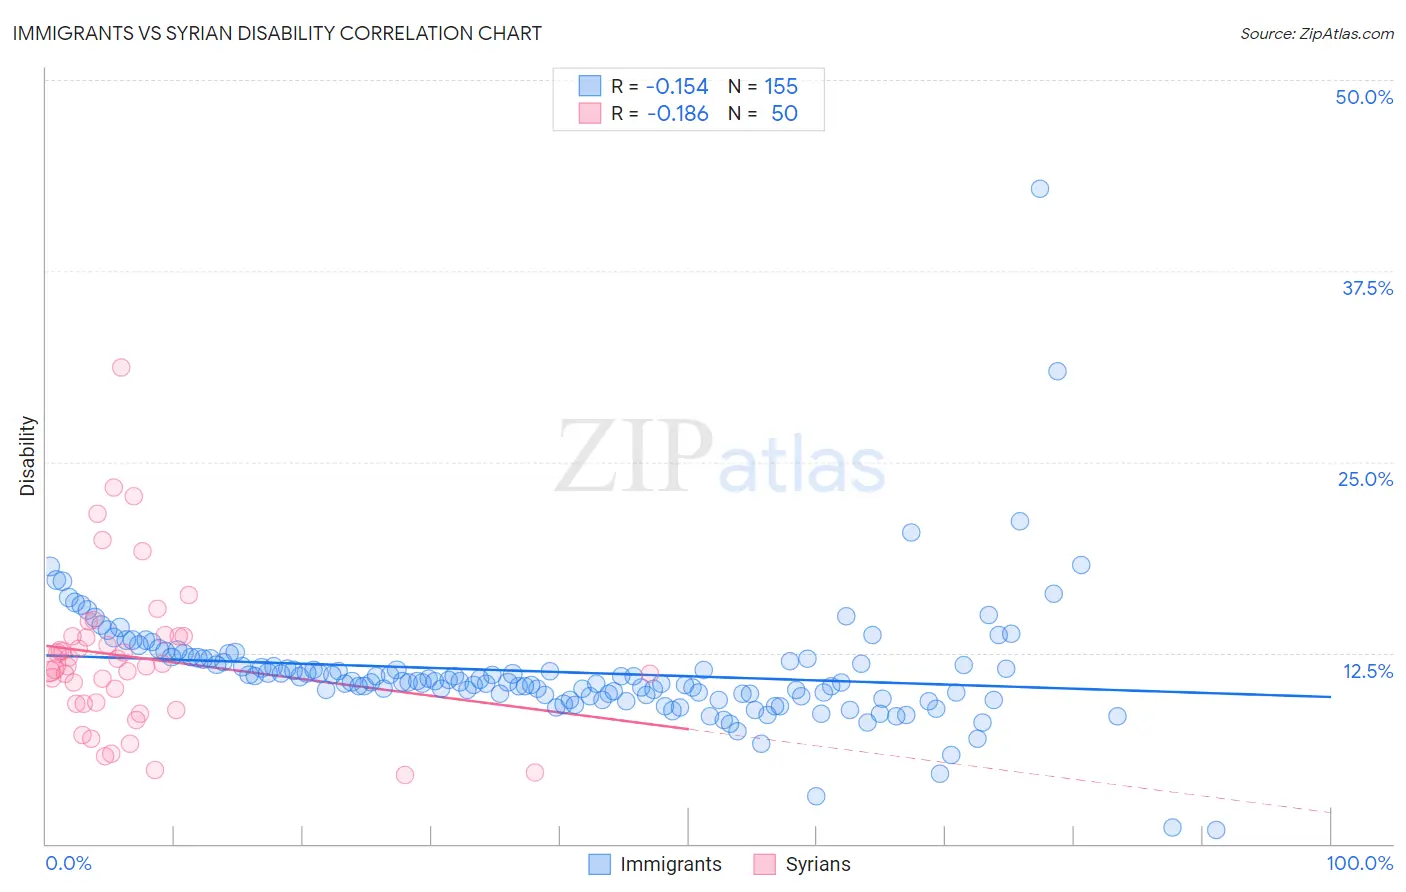
Immigrants vs Syrian Disability Correlation Chart
The statistical analysis conducted on geographies consisting of 577,602,832 people shows a poor negative correlation between the proportion of Immigrants and percentage of population with a disability in the United States with a correlation coefficient (R) of -0.154 and weighted average of 11.3%. Similarly, the statistical analysis conducted on geographies consisting of 266,315,243 people shows a poor negative correlation between the proportion of Syrians and percentage of population with a disability in the United States with a correlation coefficient (R) of -0.186 and weighted average of 11.7%, a difference of 3.4%.
Disability Correlation Summary
| Measurement | Immigrants | Syrian |
| Minimum | 0.89% | 4.5% |
| Maximum | 42.9% | 31.2% |
| Range | 42.0% | 26.7% |
| Mean | 11.3% | 12.2% |
| Median | 10.6% | 11.7% |
| Interquartile 25% (IQ1) | 9.7% | 9.2% |
| Interquartile 75% (IQ3) | 12.1% | 13.6% |
| Interquartile Range (IQR) | 2.4% | 4.4% |
| Standard Deviation (Sample) | 4.1% | 5.1% |
| Standard Deviation (Population) | 4.1% | 5.0% |
Similar Demographics by Disability
Demographics Similar to Immigrants by Disability
In terms of disability, the demographic groups most similar to Immigrants are Immigrants from Uruguay (11.3%, a difference of 0.010%), Immigrants from Kazakhstan (11.3%, a difference of 0.010%), Immigrants from Eastern Europe (11.3%, a difference of 0.040%), Nicaraguan (11.3%, a difference of 0.060%), and Immigrants from Eastern Africa (11.3%, a difference of 0.080%).
| Demographics | Rating | Rank | Disability |
| Bhutanese | 97.4 /100 | #97 | Exceptional 11.2% |
| Uruguayans | 97.4 /100 | #98 | Exceptional 11.2% |
| Immigrants | Czechoslovakia | 97.4 /100 | #99 | Exceptional 11.2% |
| Immigrants | Greece | 96.9 /100 | #100 | Exceptional 11.3% |
| Immigrants | Nicaragua | 96.8 /100 | #101 | Exceptional 11.3% |
| Immigrants | Eastern Africa | 96.7 /100 | #102 | Exceptional 11.3% |
| Immigrants | Uruguay | 96.4 /100 | #103 | Exceptional 11.3% |
| Immigrants | Immigrants | 96.4 /100 | #104 | Exceptional 11.3% |
| Immigrants | Kazakhstan | 96.4 /100 | #105 | Exceptional 11.3% |
| Immigrants | Eastern Europe | 96.3 /100 | #106 | Exceptional 11.3% |
| Nicaraguans | 96.2 /100 | #107 | Exceptional 11.3% |
| Immigrants | Nigeria | 96.0 /100 | #108 | Exceptional 11.3% |
| Immigrants | Uganda | 95.7 /100 | #109 | Exceptional 11.3% |
| Immigrants | Denmark | 95.6 /100 | #110 | Exceptional 11.3% |
| Immigrants | South Eastern Asia | 95.4 /100 | #111 | Exceptional 11.3% |
Demographics Similar to Syrians by Disability
In terms of disability, the demographic groups most similar to Syrians are Immigrants from Trinidad and Tobago (11.7%, a difference of 0.020%), Immigrants from Haiti (11.7%, a difference of 0.030%), Cuban (11.7%, a difference of 0.080%), Pakistani (11.7%, a difference of 0.17%), and Estonian (11.7%, a difference of 0.18%).
| Demographics | Rating | Rank | Disability |
| Immigrants | Middle Africa | 69.5 /100 | #157 | Good 11.6% |
| Armenians | 65.9 /100 | #158 | Good 11.6% |
| Guatemalans | 65.1 /100 | #159 | Good 11.6% |
| Immigrants | Barbados | 64.2 /100 | #160 | Good 11.6% |
| Immigrants | Cuba | 62.8 /100 | #161 | Good 11.6% |
| Immigrants | Haiti | 59.2 /100 | #162 | Average 11.7% |
| Immigrants | Trinidad and Tobago | 58.9 /100 | #163 | Average 11.7% |
| Syrians | 58.5 /100 | #164 | Average 11.7% |
| Cubans | 56.7 /100 | #165 | Average 11.7% |
| Pakistanis | 54.7 /100 | #166 | Average 11.7% |
| Estonians | 54.4 /100 | #167 | Average 11.7% |
| Immigrants | Latin America | 54.1 /100 | #168 | Average 11.7% |
| Immigrants | Austria | 53.4 /100 | #169 | Average 11.7% |
| Immigrants | Albania | 52.8 /100 | #170 | Average 11.7% |
| Immigrants | Southern Europe | 52.8 /100 | #171 | Average 11.7% |