Australian vs Immigrants from Vietnam Female Disability
COMPARE
Australian
Immigrants from Vietnam
Female Disability
Female Disability Comparison
Australians
Immigrants from Vietnam
11.7%
FEMALE DISABILITY
98.3/ 100
METRIC RATING
105th/ 347
METRIC RANK
11.5%
FEMALE DISABILITY
99.8/ 100
METRIC RATING
67th/ 347
METRIC RANK
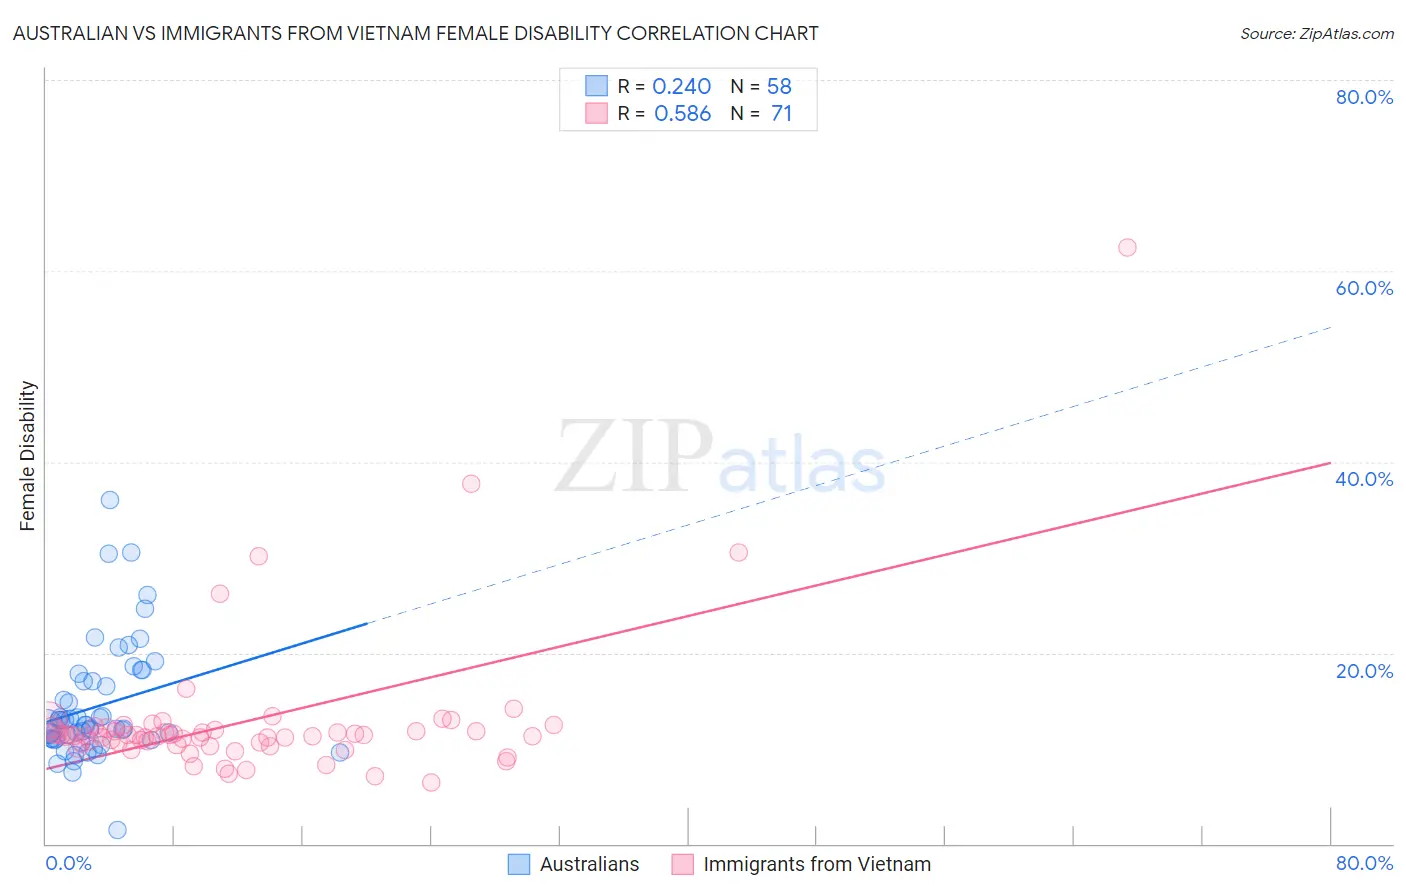
Australian vs Immigrants from Vietnam Female Disability Correlation Chart
The statistical analysis conducted on geographies consisting of 224,135,349 people shows a weak positive correlation between the proportion of Australians and percentage of females with a disability in the United States with a correlation coefficient (R) of 0.240 and weighted average of 11.7%. Similarly, the statistical analysis conducted on geographies consisting of 404,760,443 people shows a substantial positive correlation between the proportion of Immigrants from Vietnam and percentage of females with a disability in the United States with a correlation coefficient (R) of 0.586 and weighted average of 11.5%, a difference of 2.3%.
Female Disability Correlation Summary
| Measurement | Australian | Immigrants from Vietnam |
| Minimum | 1.4% | 6.4% |
| Maximum | 36.0% | 62.5% |
| Range | 34.5% | 56.1% |
| Mean | 14.4% | 12.9% |
| Median | 12.3% | 11.3% |
| Interquartile 25% (IQ1) | 11.0% | 10.5% |
| Interquartile 75% (IQ3) | 17.0% | 12.0% |
| Interquartile Range (IQR) | 6.1% | 1.4% |
| Standard Deviation (Sample) | 6.1% | 7.8% |
| Standard Deviation (Population) | 6.0% | 7.8% |
Similar Demographics by Female Disability
Demographics Similar to Australians by Female Disability
In terms of female disability, the demographic groups most similar to Australians are Immigrants from Eastern Africa (11.7%, a difference of 0.020%), Immigrants from Western Asia (11.7%, a difference of 0.020%), Immigrants from Greece (11.7%, a difference of 0.030%), Latvian (11.7%, a difference of 0.050%), and New Zealander (11.7%, a difference of 0.080%).
| Demographics | Rating | Rank | Female Disability |
| Uruguayans | 98.8 /100 | #98 | Exceptional 11.7% |
| Immigrants | Philippines | 98.6 /100 | #99 | Exceptional 11.7% |
| Immigrants | Uruguay | 98.5 /100 | #100 | Exceptional 11.7% |
| Immigrants | Costa Rica | 98.4 /100 | #101 | Exceptional 11.7% |
| Immigrants | South Eastern Asia | 98.4 /100 | #102 | Exceptional 11.7% |
| Immigrants | Eastern Africa | 98.3 /100 | #103 | Exceptional 11.7% |
| Immigrants | Western Asia | 98.3 /100 | #104 | Exceptional 11.7% |
| Australians | 98.3 /100 | #105 | Exceptional 11.7% |
| Immigrants | Greece | 98.2 /100 | #106 | Exceptional 11.7% |
| Latvians | 98.2 /100 | #107 | Exceptional 11.7% |
| New Zealanders | 98.1 /100 | #108 | Exceptional 11.7% |
| Immigrants | Immigrants | 98.1 /100 | #109 | Exceptional 11.7% |
| Soviet Union | 98.1 /100 | #110 | Exceptional 11.7% |
| Costa Ricans | 98.1 /100 | #111 | Exceptional 11.7% |
| Immigrants | Bangladesh | 97.8 /100 | #112 | Exceptional 11.8% |
Demographics Similar to Immigrants from Vietnam by Female Disability
In terms of female disability, the demographic groups most similar to Immigrants from Vietnam are Immigrants from Northern Africa (11.5%, a difference of 0.020%), Salvadoran (11.5%, a difference of 0.050%), Colombian (11.5%, a difference of 0.090%), Immigrants from Chile (11.5%, a difference of 0.10%), and Immigrants from Ireland (11.5%, a difference of 0.14%).
| Demographics | Rating | Rank | Female Disability |
| Immigrants | Bulgaria | 99.9 /100 | #60 | Exceptional 11.4% |
| Immigrants | France | 99.9 /100 | #61 | Exceptional 11.4% |
| Sri Lankans | 99.9 /100 | #62 | Exceptional 11.4% |
| Immigrants | Colombia | 99.9 /100 | #63 | Exceptional 11.4% |
| Immigrants | El Salvador | 99.9 /100 | #64 | Exceptional 11.4% |
| Immigrants | South America | 99.9 /100 | #65 | Exceptional 11.4% |
| Salvadorans | 99.8 /100 | #66 | Exceptional 11.5% |
| Immigrants | Vietnam | 99.8 /100 | #67 | Exceptional 11.5% |
| Immigrants | Northern Africa | 99.8 /100 | #68 | Exceptional 11.5% |
| Colombians | 99.8 /100 | #69 | Exceptional 11.5% |
| Immigrants | Chile | 99.8 /100 | #70 | Exceptional 11.5% |
| Immigrants | Ireland | 99.8 /100 | #71 | Exceptional 11.5% |
| Chileans | 99.8 /100 | #72 | Exceptional 11.5% |
| Immigrants | Switzerland | 99.8 /100 | #73 | Exceptional 11.5% |
| Bhutanese | 99.8 /100 | #74 | Exceptional 11.5% |